![]()
16th October 2017
Introduction
It is not our intention to write a ‘blog’ every time a club from the Premier League publishes their latest accounts. However, in this case we will make an exception – the fortunes of Arsenal regularly crop up as a discussion point when we deliver presentations as part of our work with clients. Arsenal may not have won the Premier League since the 2003-4 season but after Manchester United, it is the club where the most questions regarding the club’s economic position are forthcoming.
With several well-known “celebrity” fans – Piers Morgan is a regular commentator (and latterly a critic of the club’s manager, Arsene Wenger) – plus Idris Elba, Colin Firth, Joan Collins, Barbara Windsor, Alan Parker, Sam Mendes, Rory McGrath, Nick Hornby and Roger Waters ranking amongst the long-list of high-profile personalities who have pledged allegiance to the North London club, it is not entirely surprising that interest in the club is so high.
The ‘Bank of England’
If we go back almost 100 years to the 1920s, with the club under the innovative stewardship of Herbert Chapman, Arsenal developed a reputation for big spending and for even bigger gate receipts. It wasn’t long before the club became known colloquially as the ‘Bank of England’. In the minds of the public, this reputation is seemingly an enduring one – even today when people, irrespective of their football allegiance, ask us about our work they often begin with the following assumptive question;
“Well, surely Arsenal must be the best performing club financially….”
Through the revenue lens
Indeed, when one looks in isolation at the club’s revenue performance over the period 2012-17, one can only be impressed. The club has produced an absolute increase in revenue of £181m or 74% and furthermore, at a compound rate of growth 11.8% per annum.
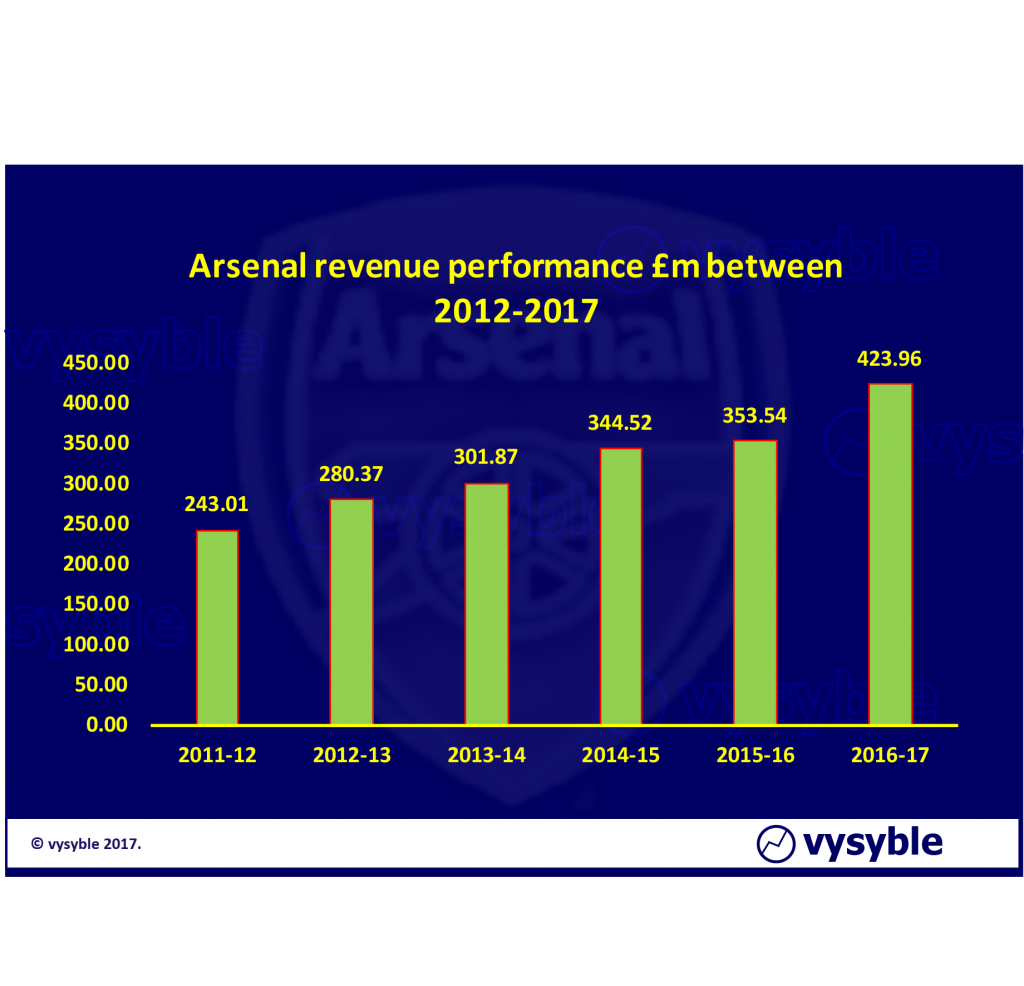 Fig. 1. Arsenal’s revenue growth profile.
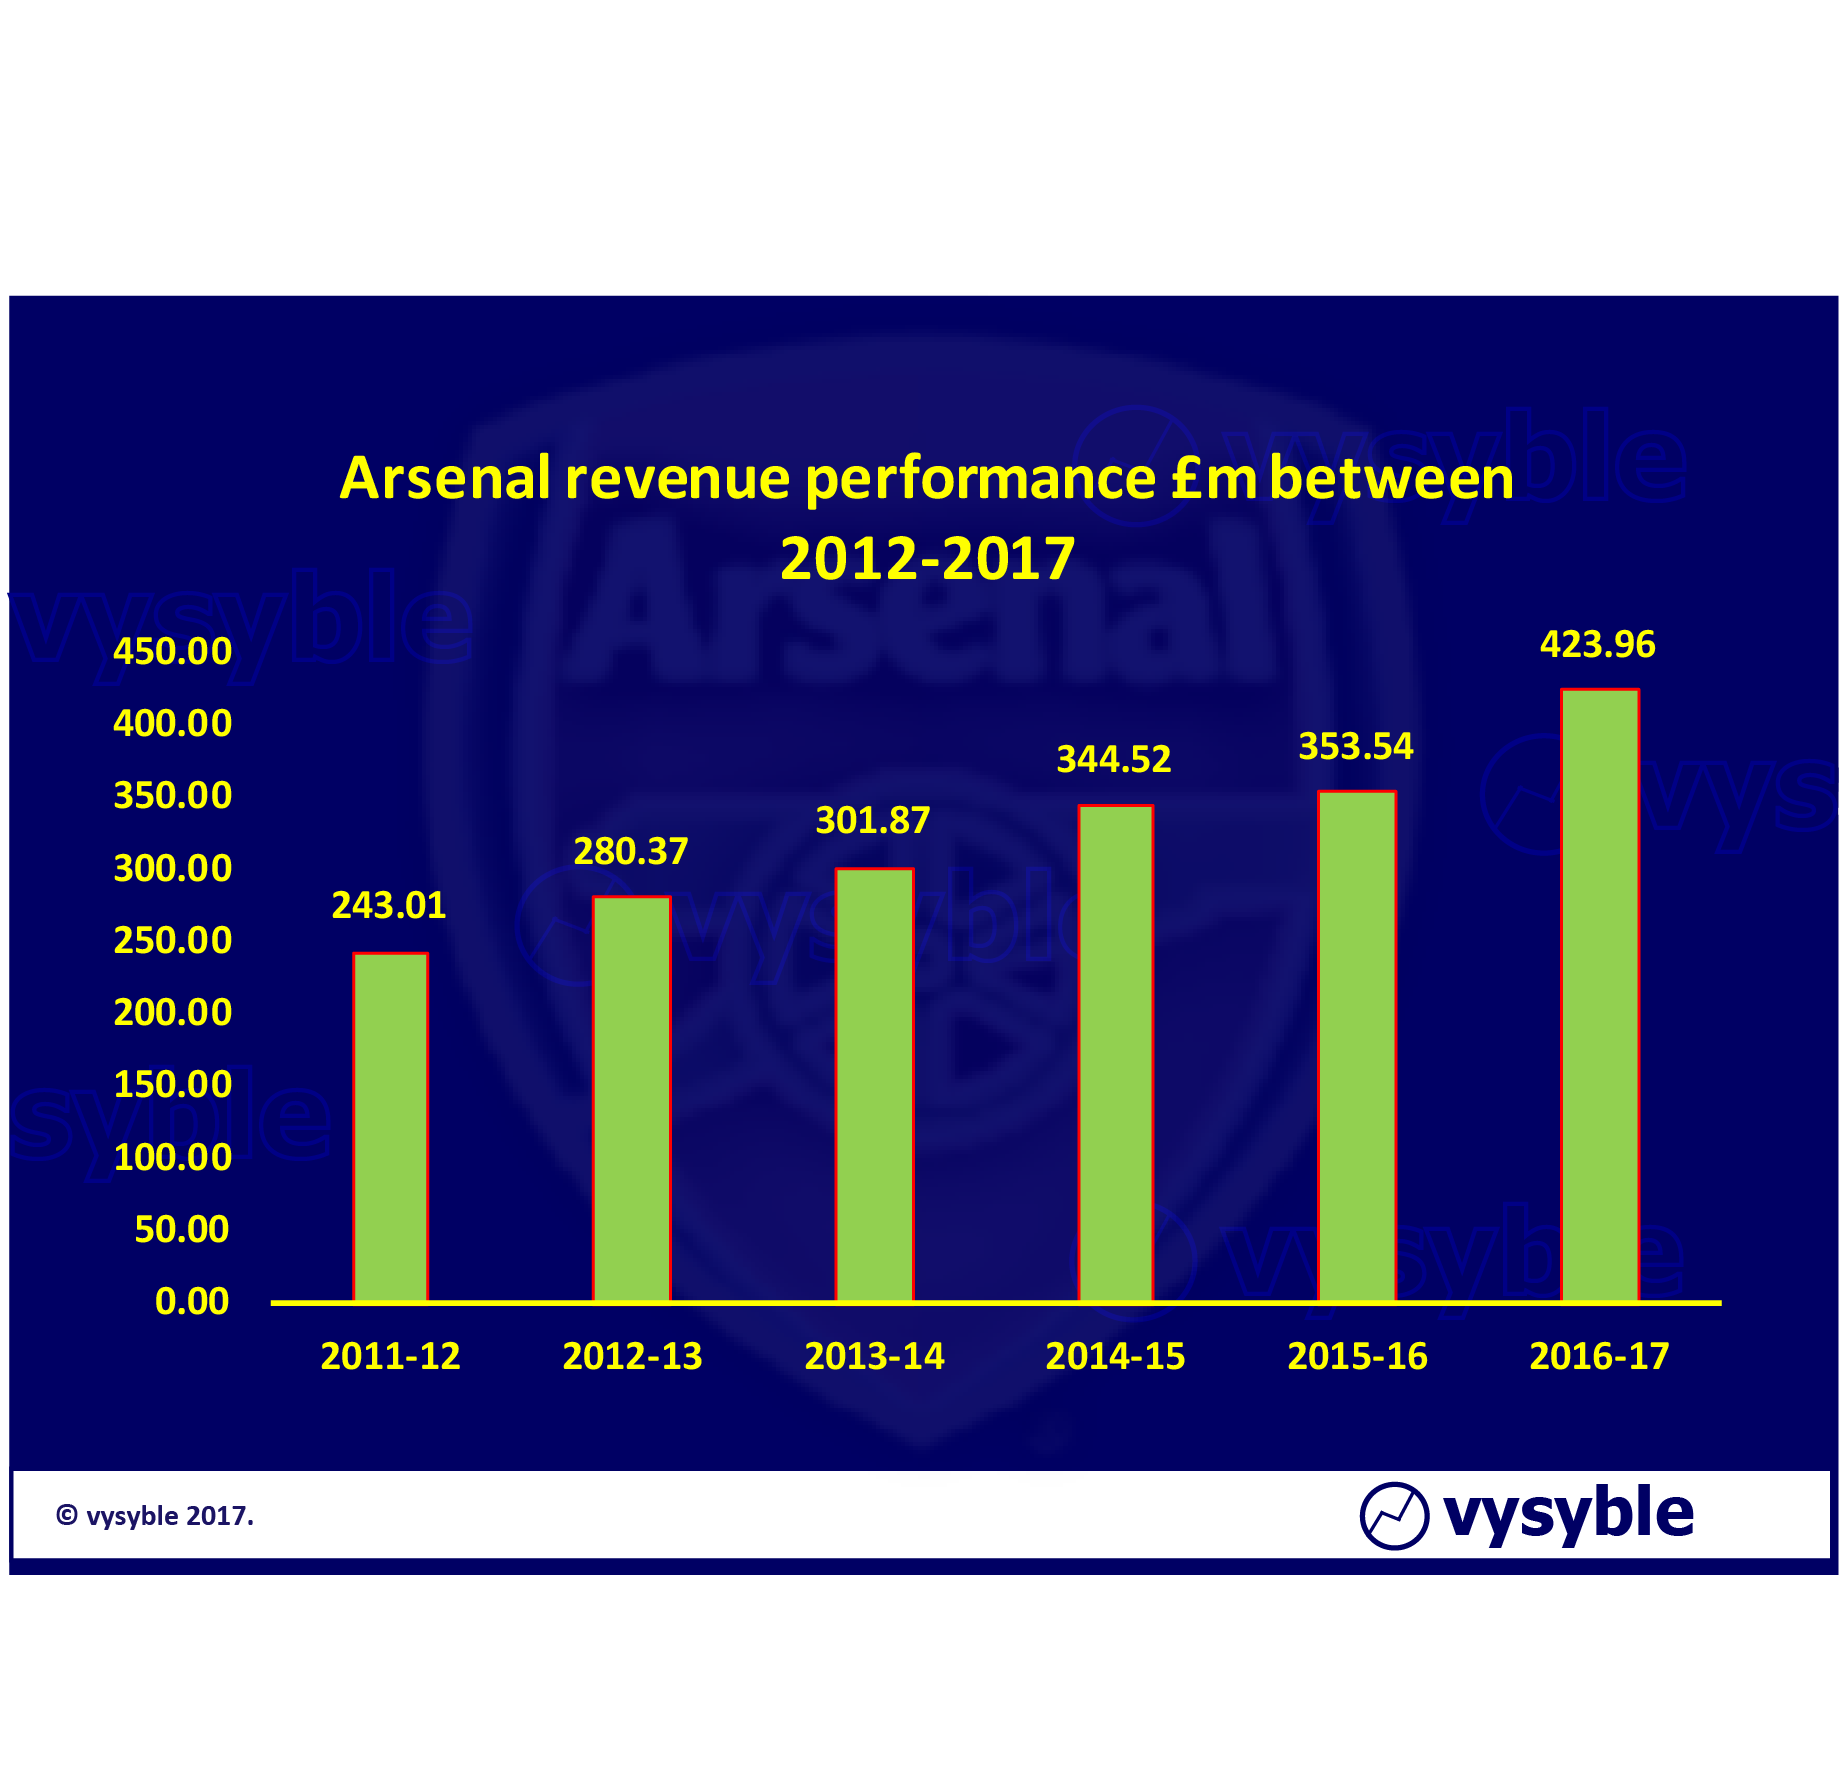
Our clients in the commercial sphere would undoubtedly envy such performance and when viewed through this lens the club’s “Bank of England” reputation would appear to be in safe and secure territory.
However, the great Roberto Goizueta – CEO of Coca-Cola between August 1980 and October 1997 (and surely a candidate for the most outstanding businessman of the 20th Century in producing returns for shareholders over his tenure of close to 7,100%) once said;
“The curse of all curses is the revenue line”
Goizueta was referring to the difficulties managers, owners and executives have in saying “no” to revenue even when it is clearly value-destroying as well as highlighting the dangers of judging the economic health of an organisation purely from the revenue line. Sadly, and despite the great man’s wise counsel, the myth that all revenue is value-enhancing perpetuates to this day. It is something that is experienced almost daily in business consulting.
Economic Profit – a more demanding measure of performance
We prefer the use of economic profit defined as net operating profit after tax less a charge for ALL of the capital used by the organization. Furthermore, when working with clients, we advocate looking at economic profit over time.
Set out below is a graphic showing the revenue and economic performance over the period 2012 through to 2017:

Fig.2. Over the period 2012-17, revenues equalled £1.9bn. However, there is an improvement in economic performance with the club posting a relatively minor loss of £4.4m in 2017 although over the six years of analysis, the club has produced a total economic loss of £133.8m without any incidence of a surplus.
What is going on here? Despite impressive revenue growth and whilst there is a significant improvement in 2017, the club has not produced a positive economic profit over the last six years.
Often the best way to discern organisational performance at a more detailed level is to analyse the movement across the constituent parts of the economic profit calculation; in this case revenue, costs including taxation, NOPAT, the charge for capital and the resulting economic outcome between the beginning and the end of the analysis period.
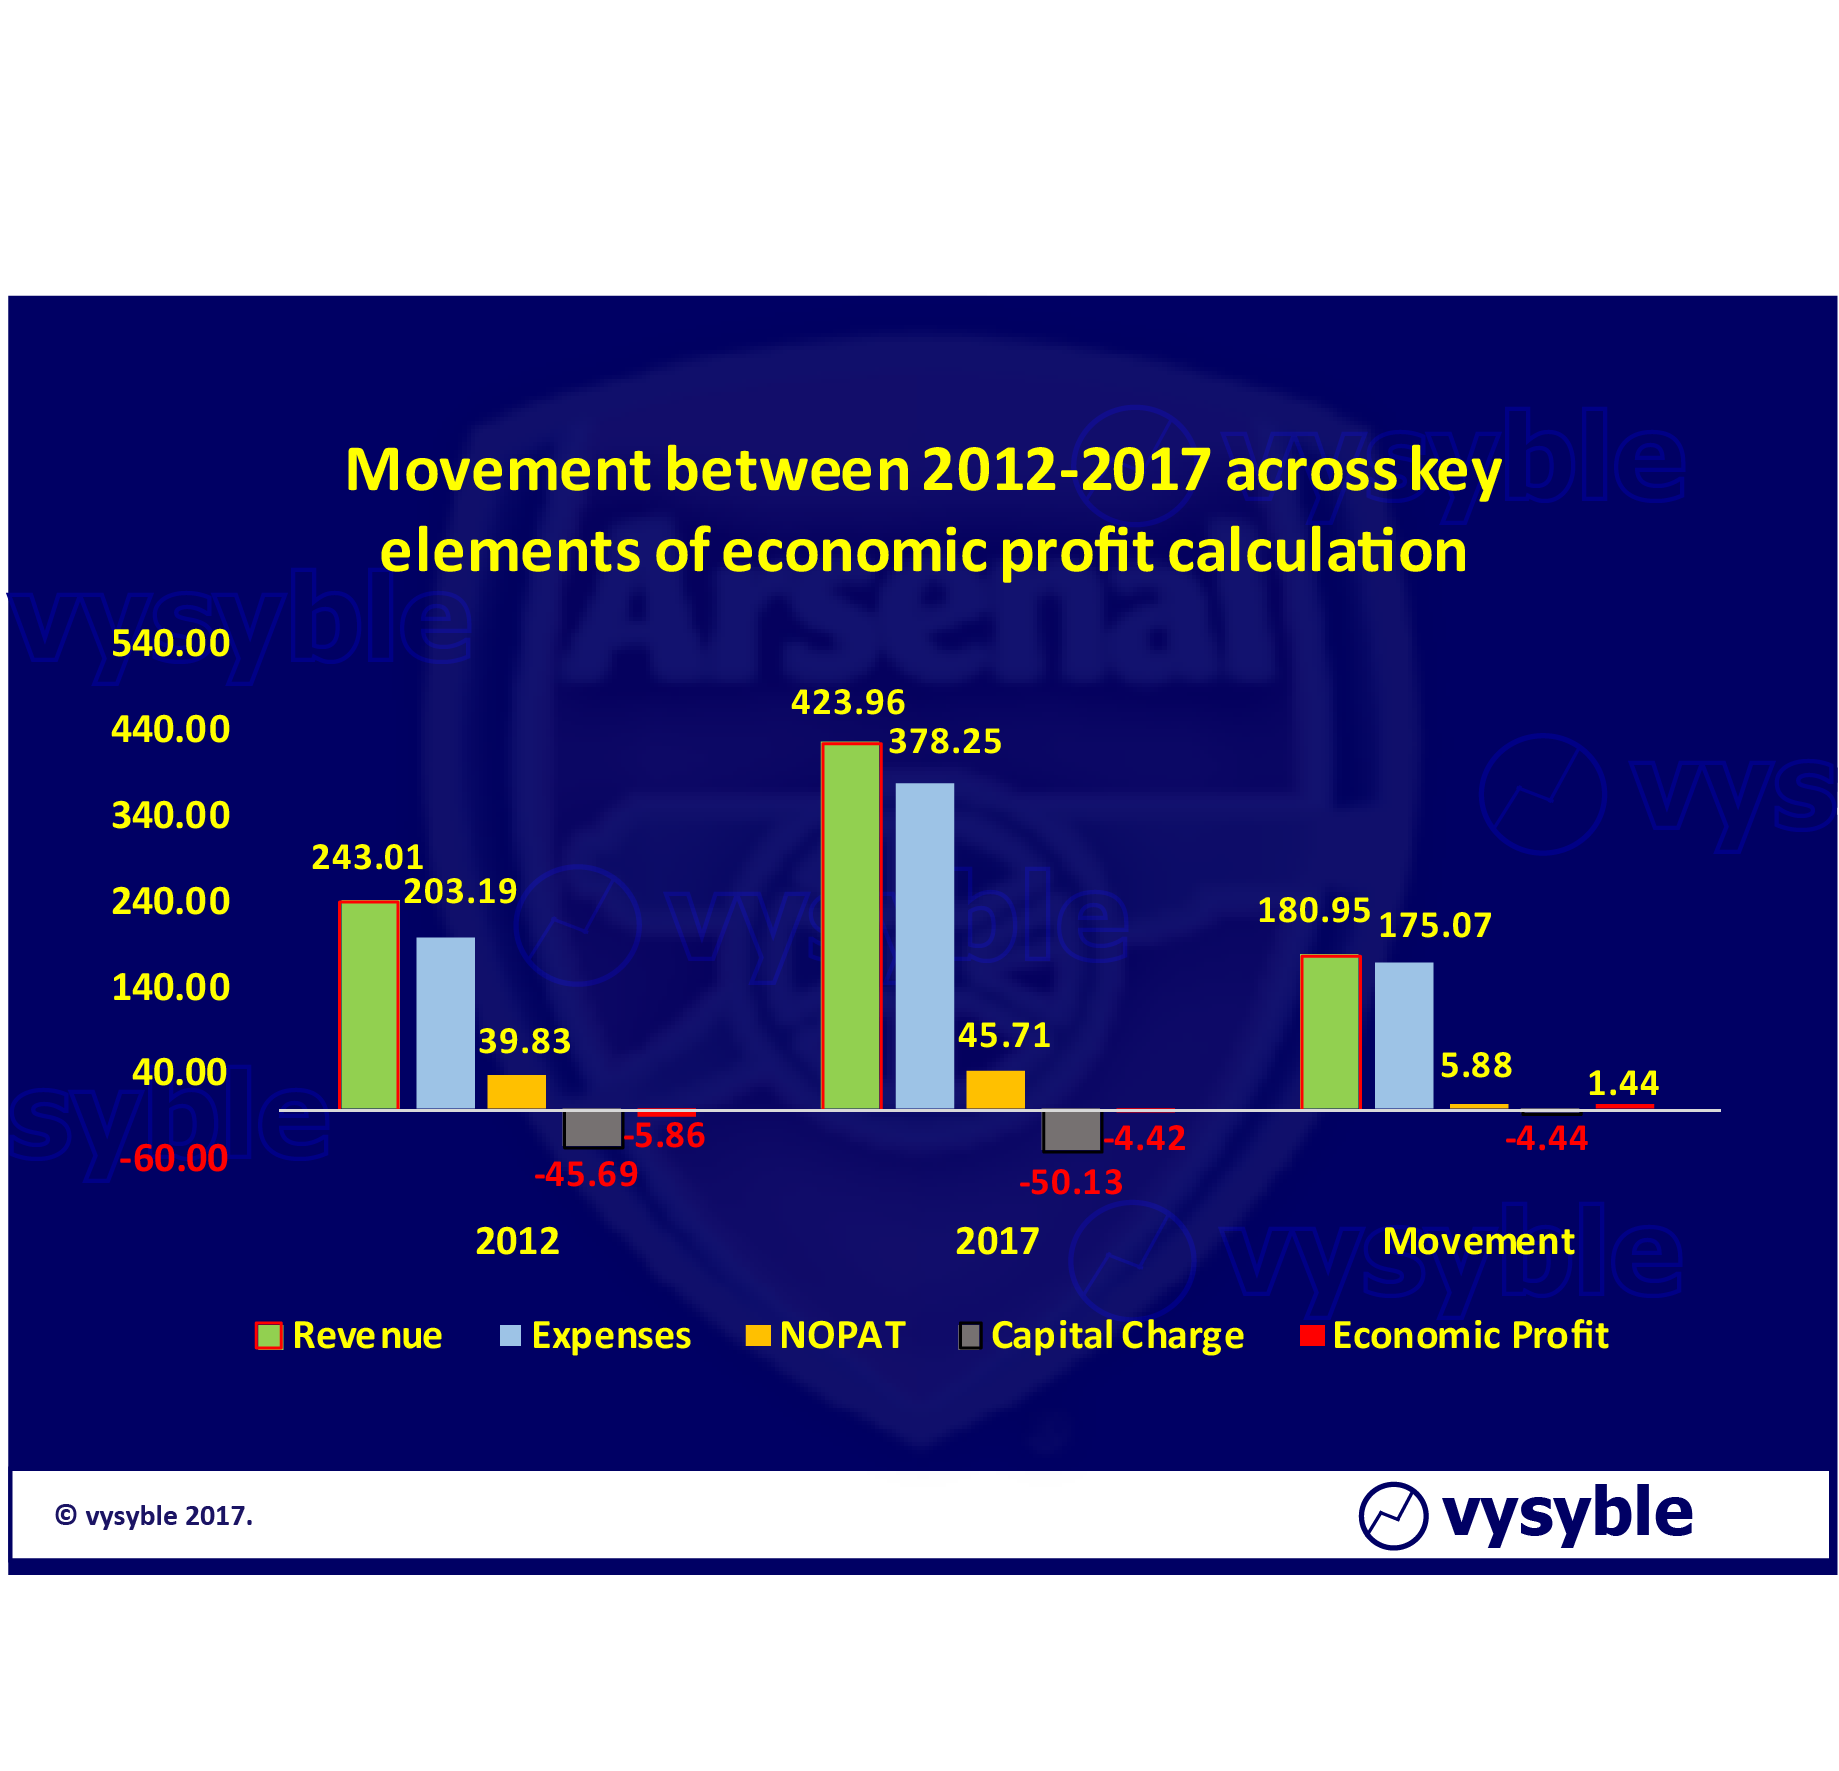
Fig.3. The increase in revenue is £181m whilst costs have increased by £175m. The capital charge has increased by £5m which means that there is an overall increase in economic profit of £1m. Evidently, and more importantly, revenue and costs are broadly in line.
What this evidently illustrates is that the impressive growth in revenue, which amounts to £181m between 2012 and 2017, has been closely matched by an increase in expenditure with costs rising by £175m over the period. This demonstrates the danger of judging organisational performance on revenues alone as, in this case, we can clearly see that almost all the impressive revenue growth has been taken in expenses.
Arsenal is not alone
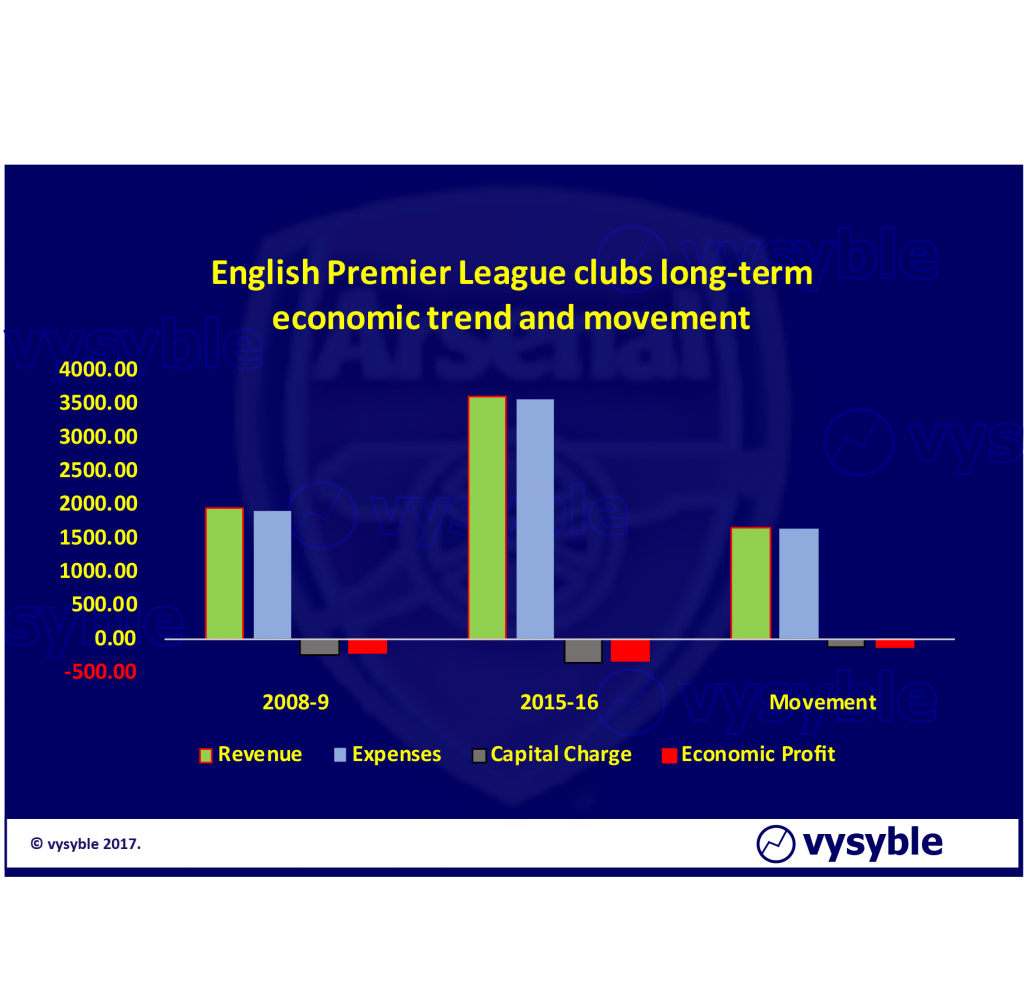 Fig.4. Whilst revenues for the Premier League have increased by £1.6bn, so too have expenses. The charge for capital has also increased by 55% from £221m to £342m. The total economic loss in 2015-16 is £320m, an increase of £128m (66%) from the 2008-9 value.
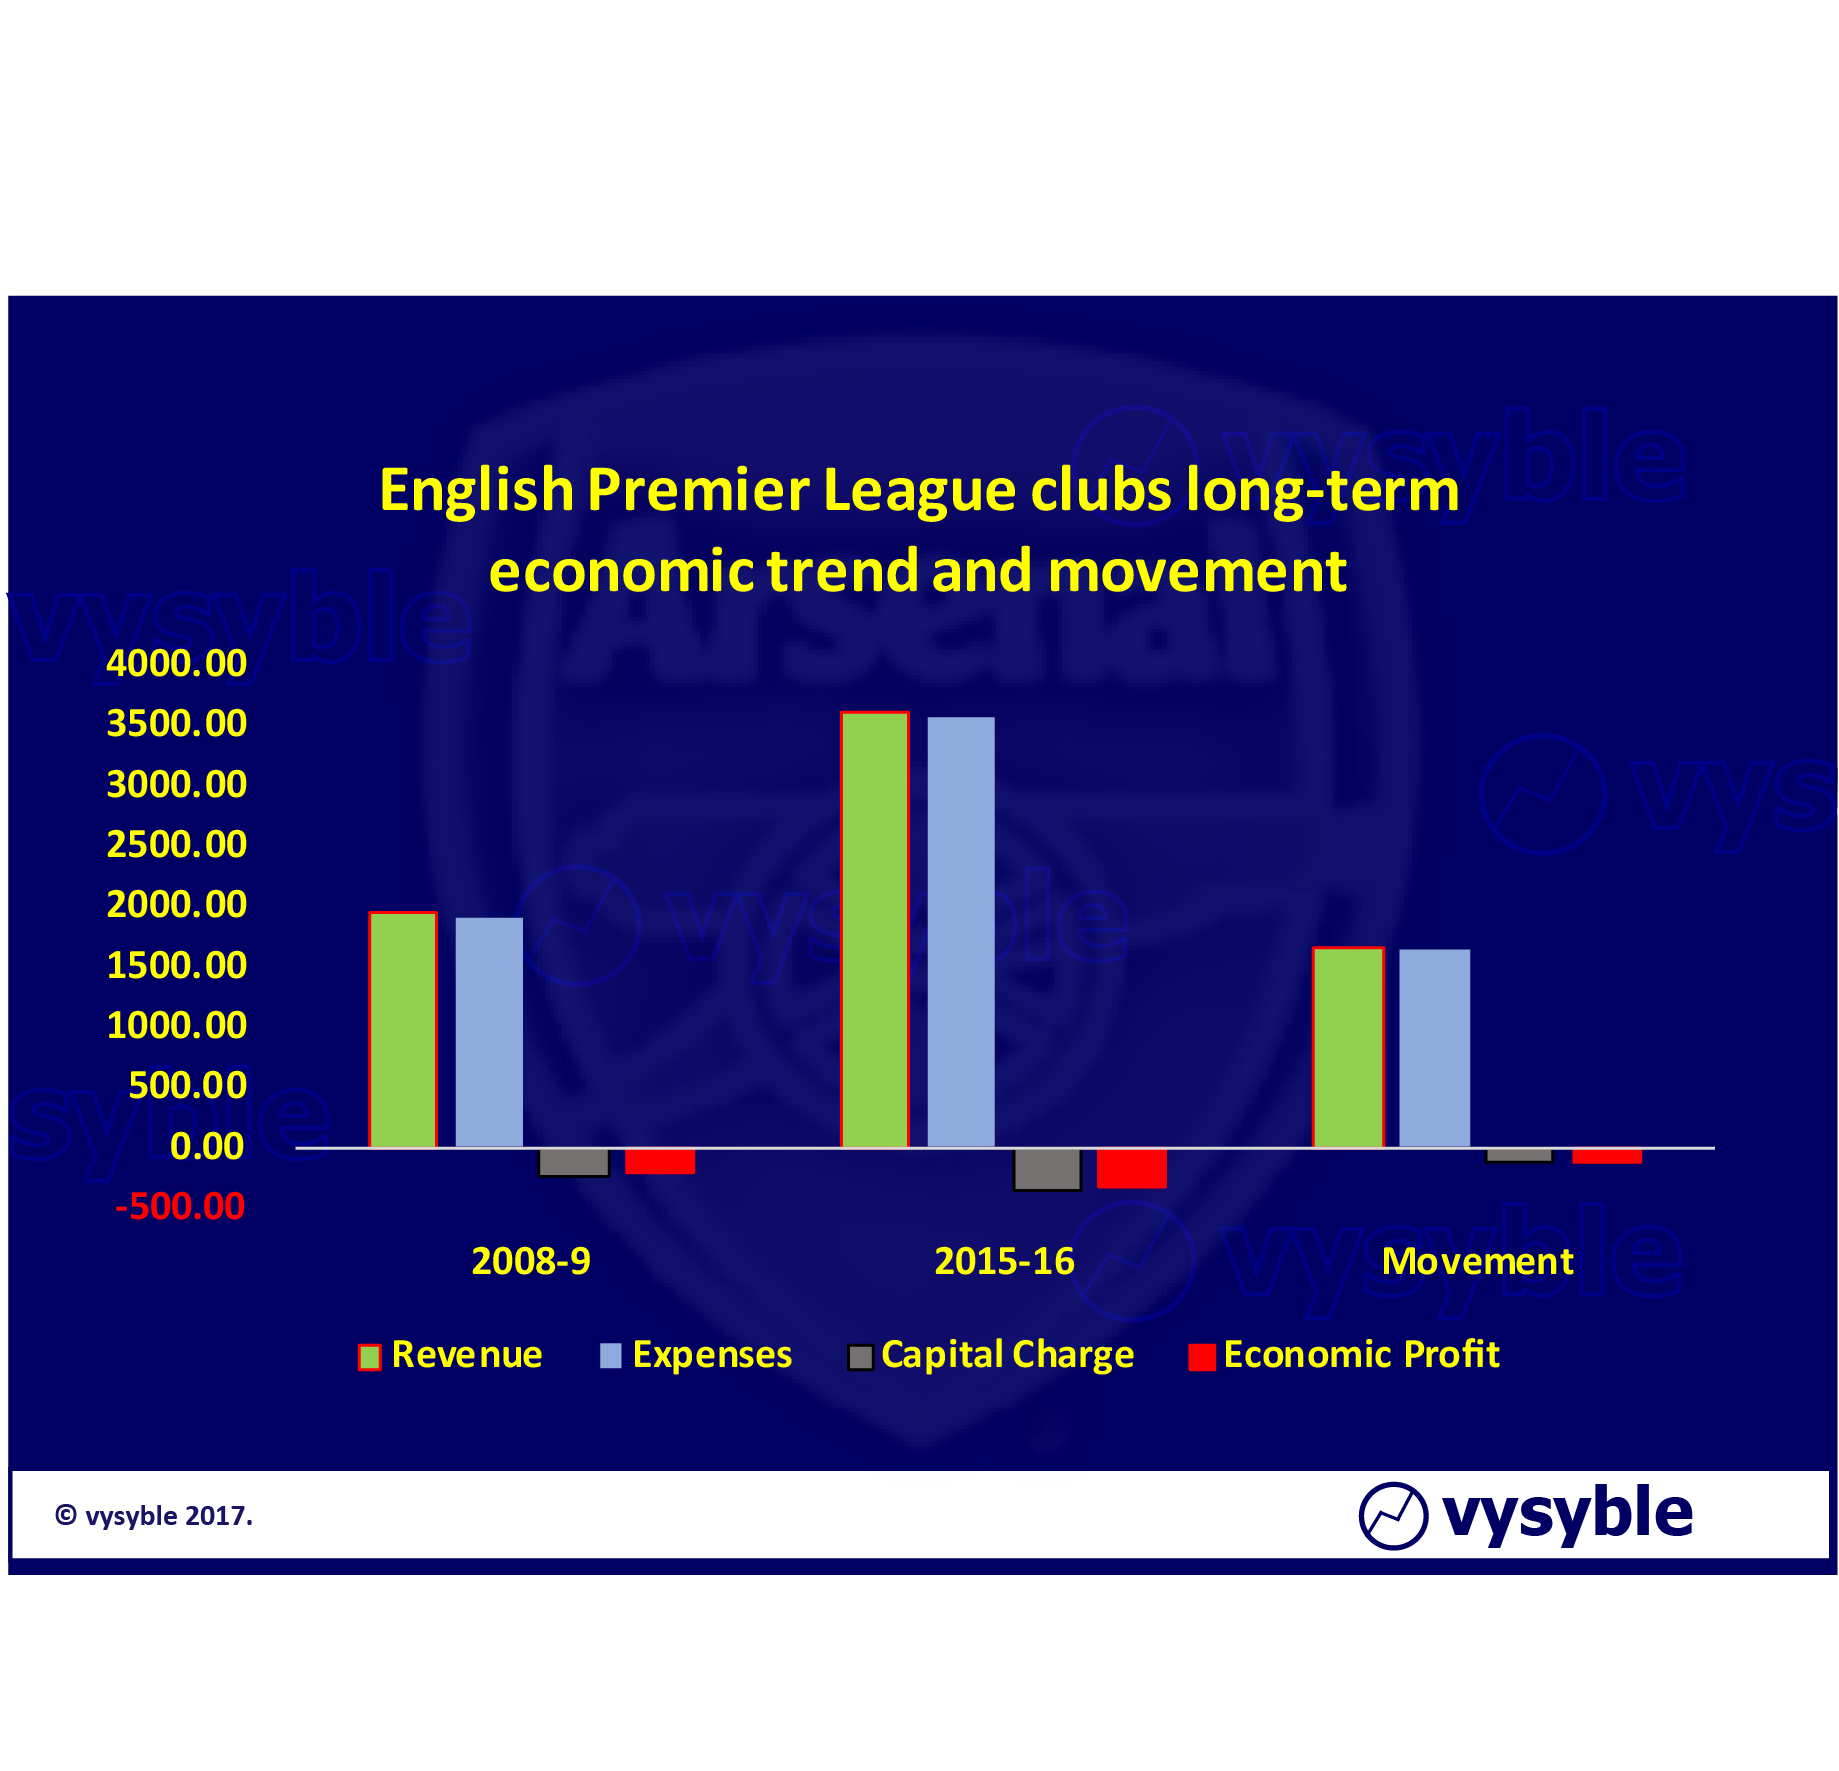
The graphic above shows the total revenue, total expenses (including tax), the charge for capital and the resulting econmic profit for all clubs within the Premier League in the 2008-9 and 2015-16 seasons. The expenses line has been reversed to ease comparison and again this shows that overall the impressive growth in the revenue line (£1.6bn) has been matched by an equivalent increase in expenditure – the movement in the revenue and expenses lines are almost identical.
Just to be completely clear and whilst one doesn’t want to labour the point – all of the huge growth (85%) in revenue (£1.6bn) has been expensed – presumably player wages and the fees of their agents are a large part of this.
Some commentators think we are being alarmist in delivering this outline – well so be it.
How Arsenal compares against Tottenham Hotspur and Manchester United
Set out below is the economic performance for each club over the period 2012 through to 2017:
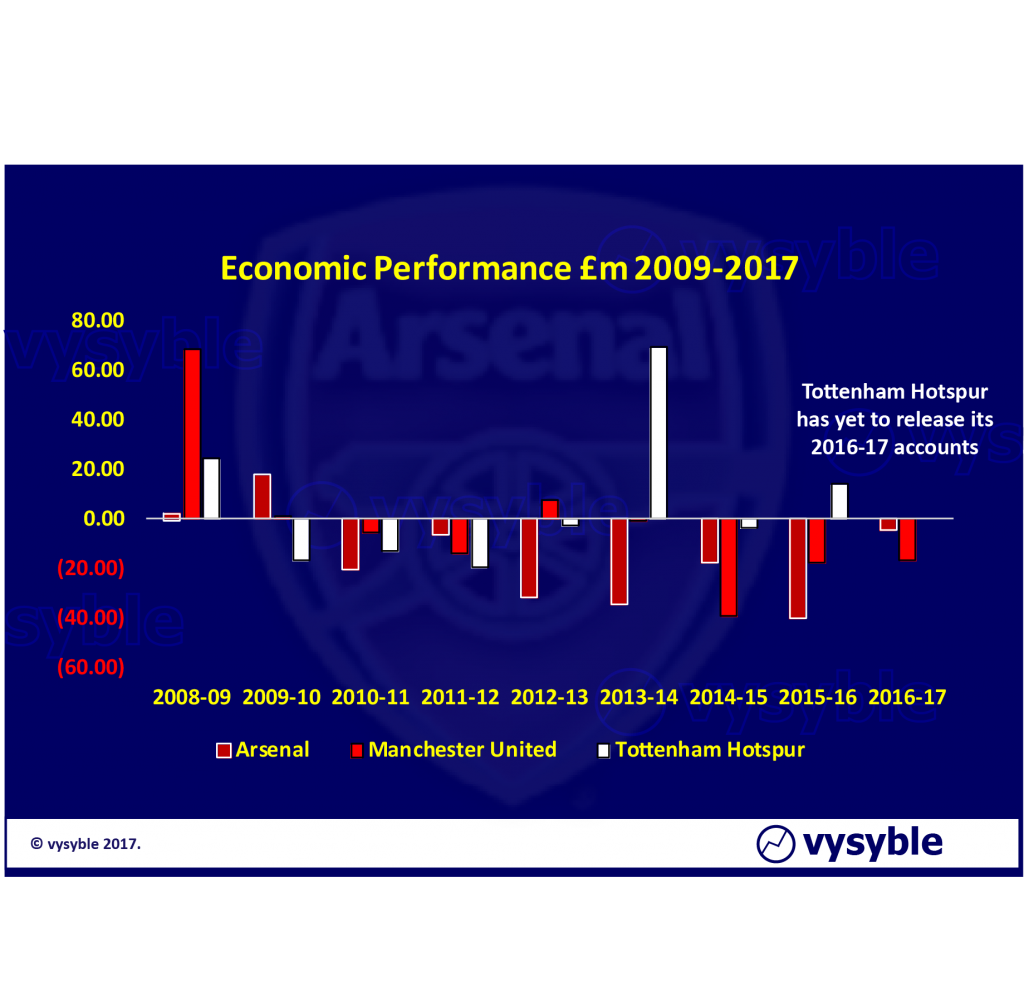 Fig. 5. Arsenal’s economic performance has been one of steady if shallow decline since 2010.
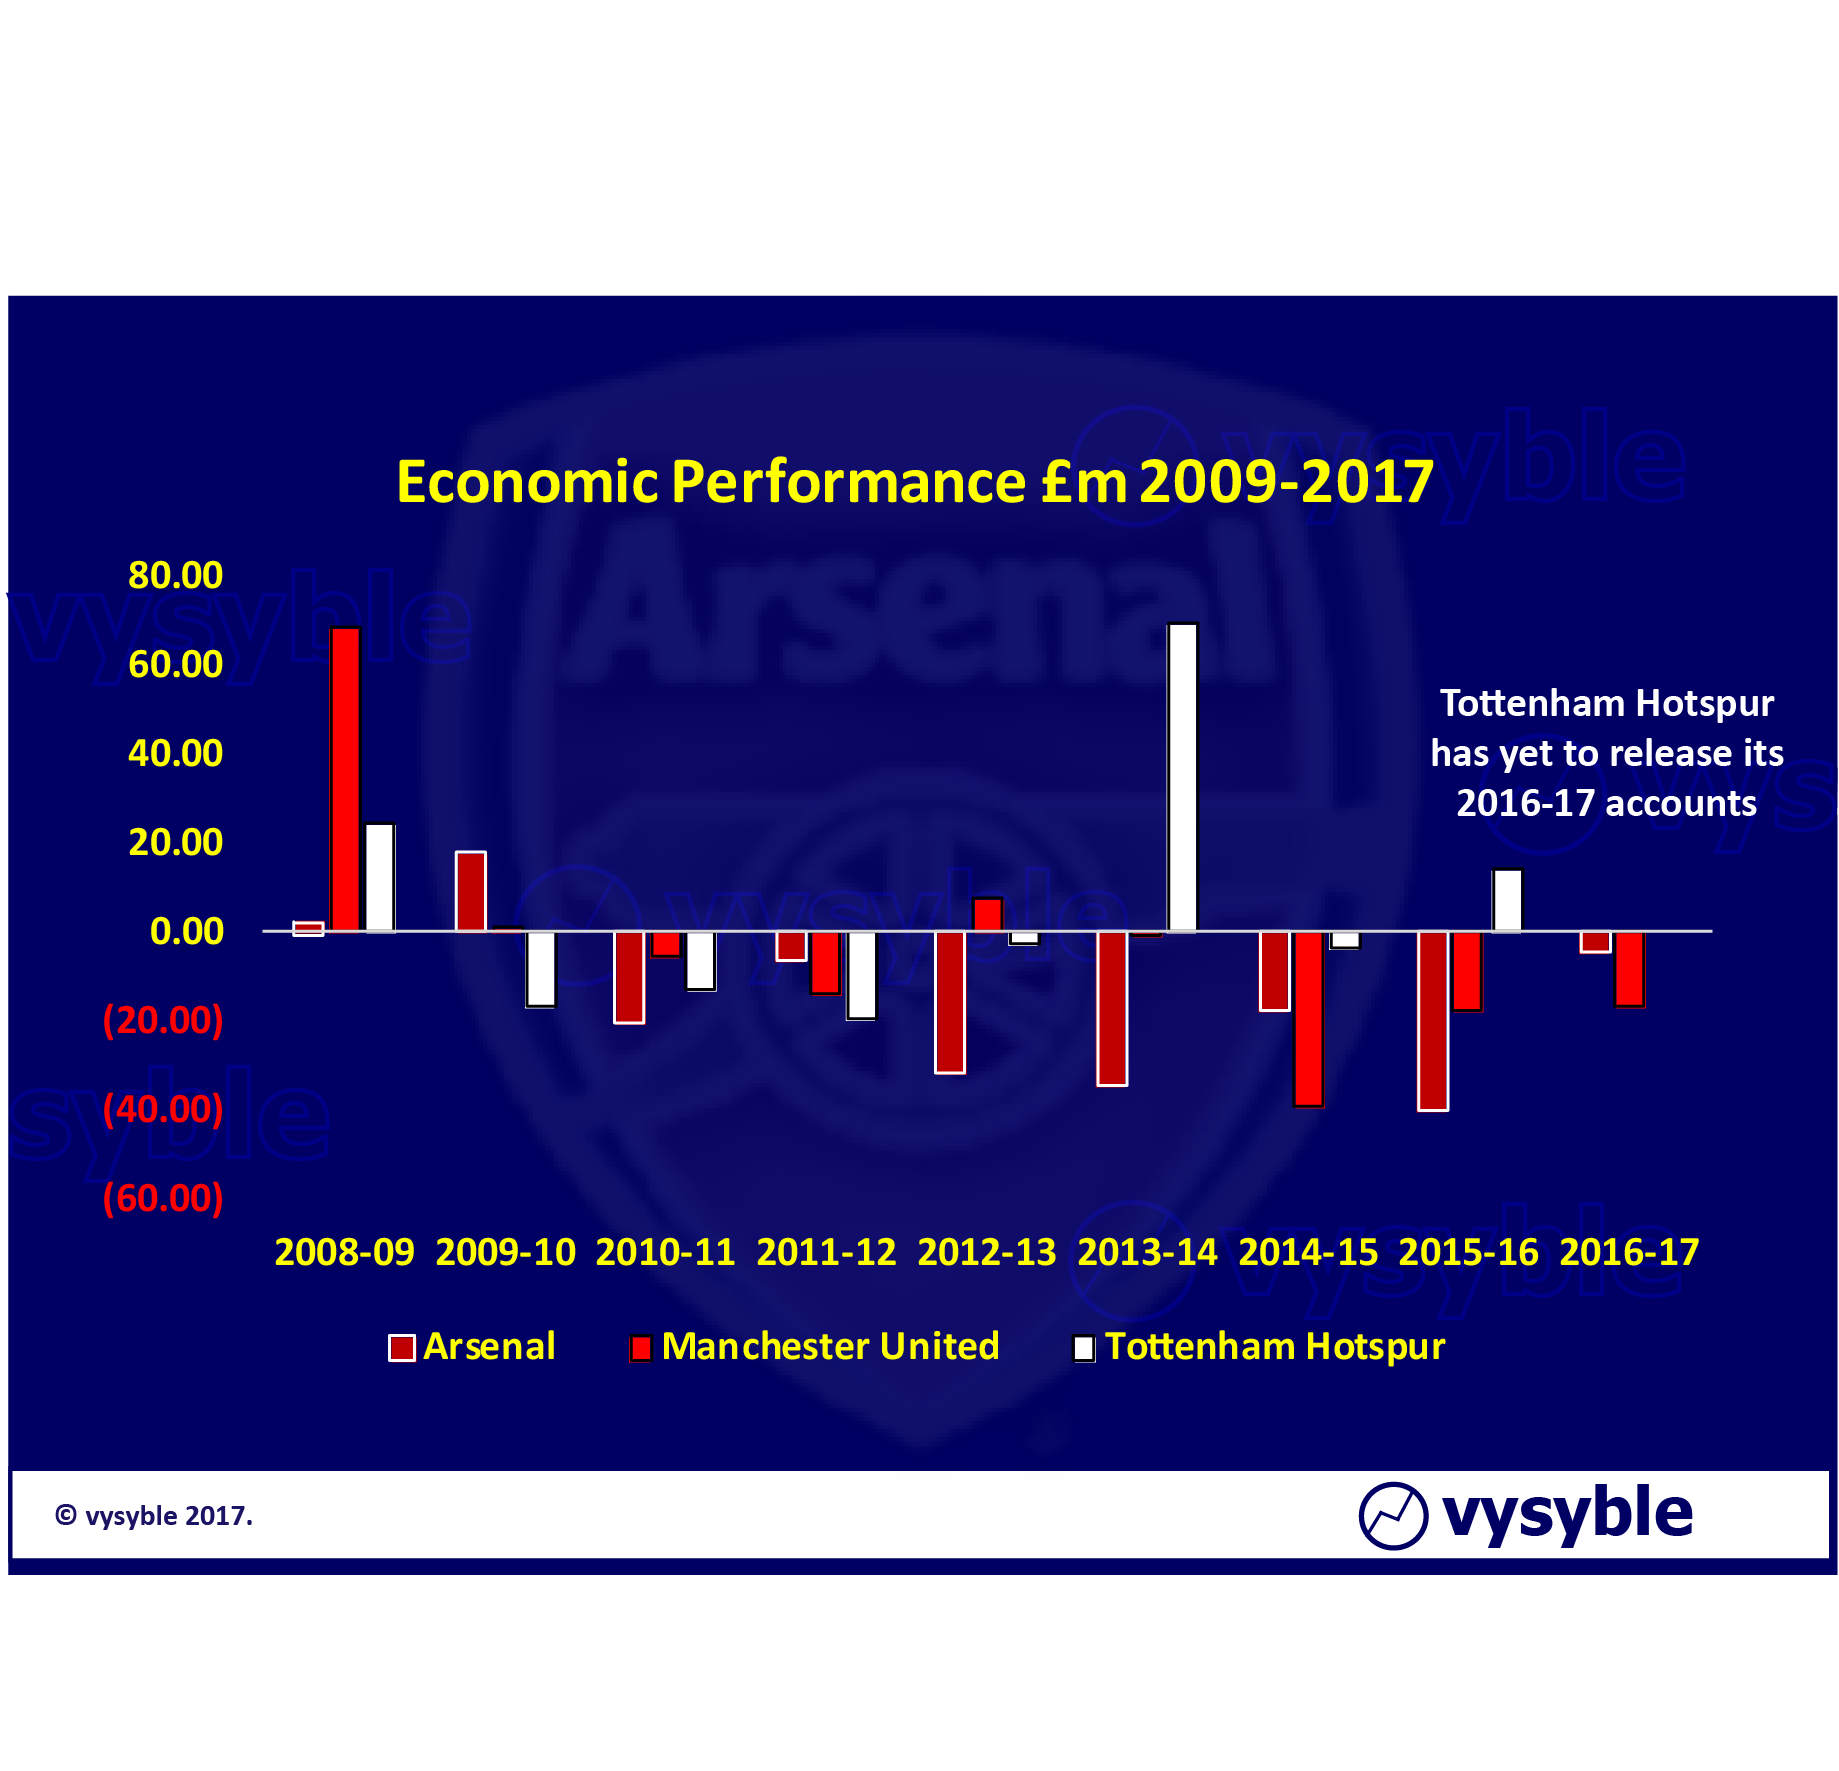
Overall, Arsenal’s North London neighbours Tottenham Hotspur (under the excellent stewardship of Mr Levy) is in economic surplus. Over the five years from 2012 through to 2016 (the numbers for 2017 have not been released just yet) the club produced an economic surplus of £58.4m. By contrast, Arsenal’s economic loss over the last six years ie 2012-17, is £133.8m despite the club’s significant economic improvement in 2017.
Over the same period, Manchester United posted an economic loss of £80.9m which, given the size of its balance sheet and the geographic spread of its revenue base, is not remotely terminal but nonetheless it will need to be managed going forward (and we have every confidence that it will be).
In terms of economic efficiency, when we look at the relationship between economic profit and revenue, we can see just how far Arsenal is behind both its North London rivals and its traditional Mancunian adversary.
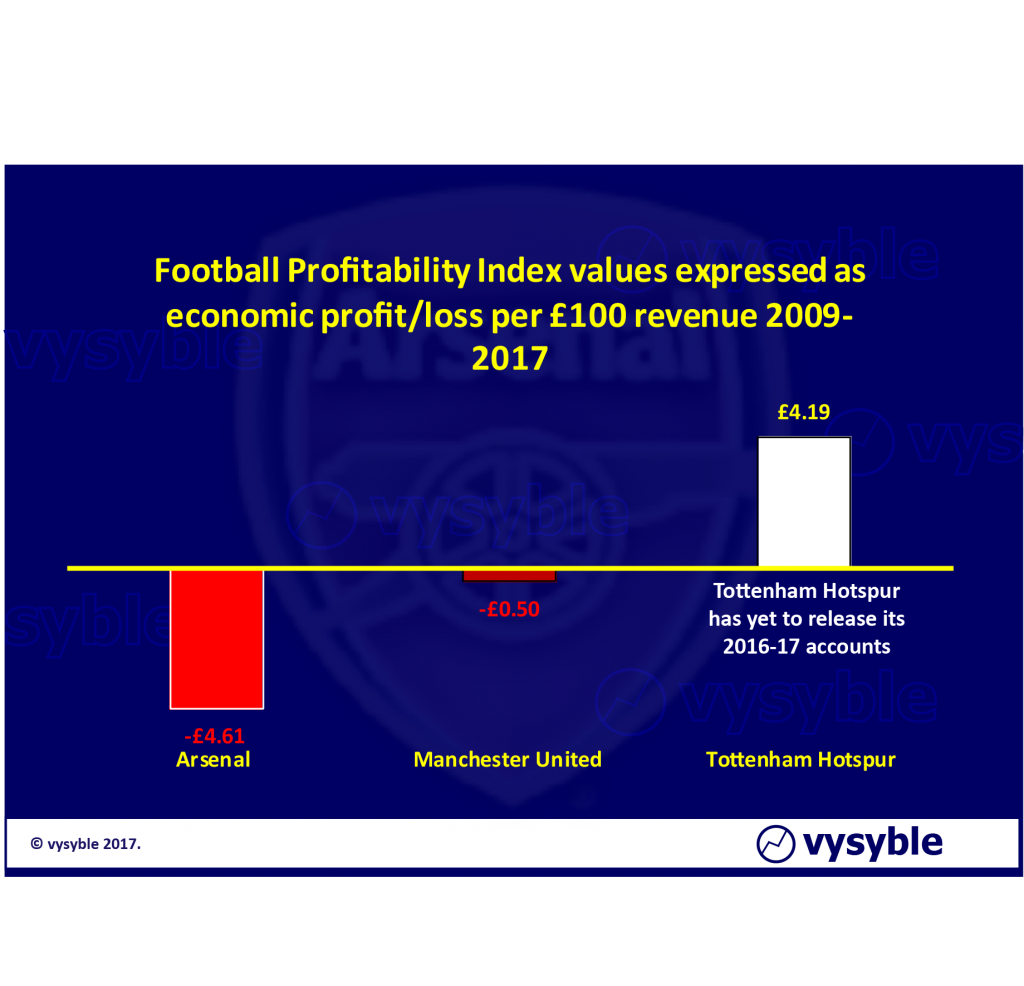 Fig. 6. A near £8 per £100 of revenue differential exists between the North London neighbours. Will Tottenham Hotspur’s next set of accounts widen the gap even further?

Conclusion
Nobody is pretending that Arsenal’s economic position is terminal but perhaps this work does shed some light on the Mr Wenger’s apparent reluctance to spend aggressively in the transfer market over recent years. Furthermore, there is evidence in the most recent numbers that economic performance is improving.
All that said, from our other work we have seen that in the first year of a new TV deal, economic performance across the entire Premier League does improve (although there are still a significant number of clubs generating economic losses), usually for a solitary season before normal service is resumed and the trend reverts into more challenging economic territory in the subsequent years of the TV contract cycle.
Whilst Tottenham Hotspur have not yet released its 2017 numbers, the gap between its 5-year track record of economic profit and Arsenal’s 6-year total (of economic profit) stands at £192.3m – a sum that is more than enough to purchase two decent central defenders or perhaps the more productive half of a certain Lionel Messi?
Against this background (and again stressing that the position is certainly not terminal), the club’s reputation as English football’s “Bank of England” perhaps needs a re-visit?
vysyble