This guest post was written by Vysyble, a UK based corporate valuation consultancy
“(Strategy is) The determination of the long-run goals and objectives of an enterprise and the adoption of courses of action and the allocation of resources necessary for carrying out these goals.”
– Alfred Chandler, Strategy and Structure (Cambridge, MA: MIT Press 1962)
Business strategy is a challenging subject. Unfortunately, much of the associated theory and practice of business strategy tends to lack a valid and sustainable economic framework. Assumptions, which are not only highly questionable but when left unchecked, lead to beliefs which become shibboleths of corporate thinking. Good business strategy must rest on the foundations of concrete, measurable and important economic objectives.
Given our experience within the corporate sector, the adoption of standardised goals to produce superior economic returns eg increasing customer satisfaction or achieving economies of scale, needs to be challenged. Add in the oft-held assumption that creating shareholder value is the same as maximizing short-term “profit,” and before long a highly poisonous strategic cocktail is in place with the potential for further commercial mayhem.
Sadly, many of these siren goals are simply myths that frequently confuse cause and effect, lack evidential support and thus cloud good strategic decision-making.
What do we mean by Value Creation?
Arguably, the guiding principle of value creation is a simple construct: companies that generate a return on capital that exceeds the cost of that capital, create value. First published over 120 years ago by the great economist Alfred Marshall (Principles of Economics – New York, Macmillan, 1890) but building on the work of Adam Smith, it remains as relevant today as it did back then. Furthermore, when CEOs, Boards, Investors and advisors forget this basic and simple principle, the results have often been nothing short of calamitous for shareholders, employees and other stakeholders e.g. the 2008 Banking Crash, the rise of conglomerates in the late 1960s and 70s, the internet bubble et al…
The Problem with Earnings
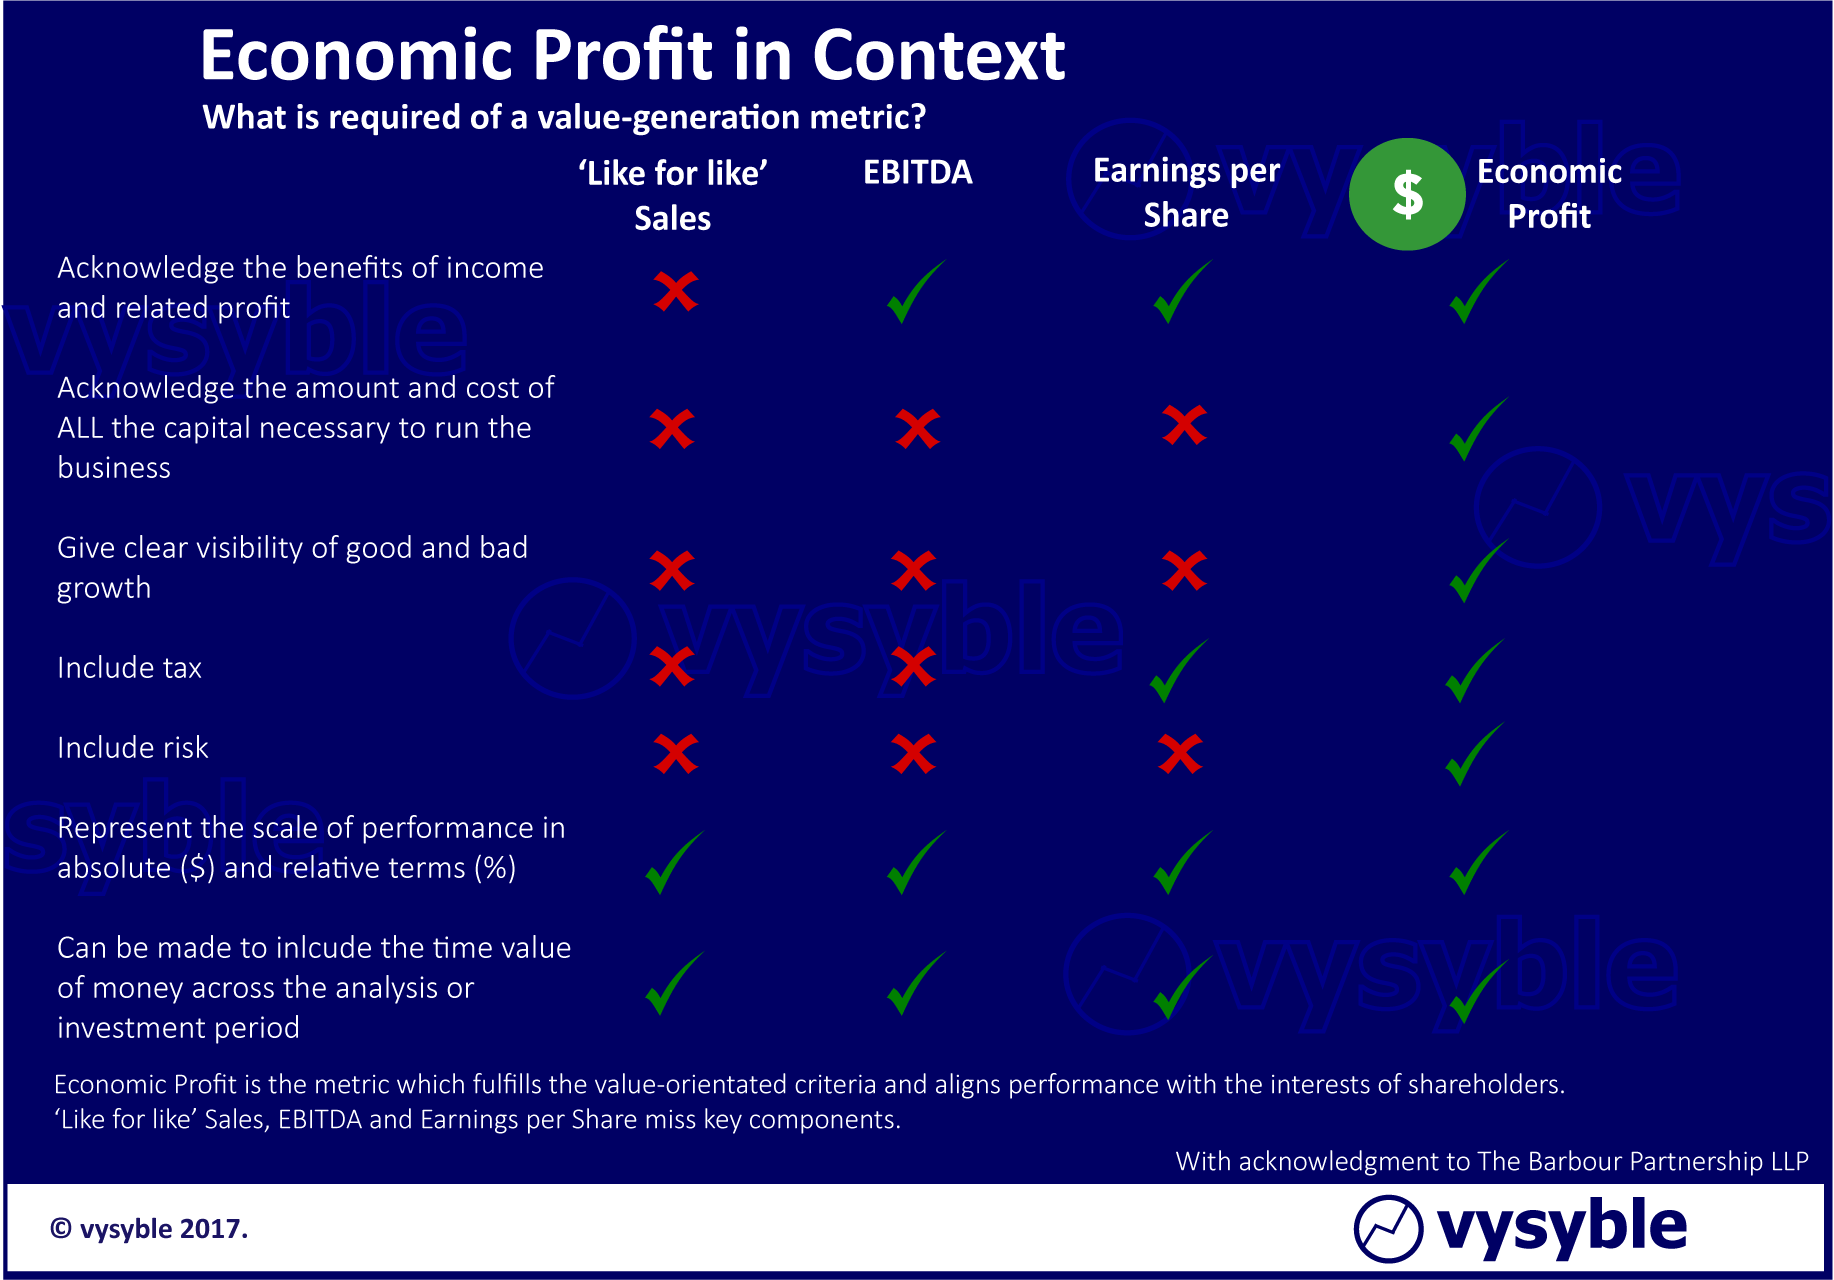
As most financial analysts demand a performance metric – accounting earnings or some variant such as EBITDA – it is very easy to forget Marshall’s great work. Why? Because an earnings-driven metric suffers from the following deficiencies:
– It is an “incomplete” measure of performance as it does not include any element for the amount and cost of all the capital needed to run and grow the business
– It is not a measure of cash flow. Earnings last year or next year tells us very little about the cash flows that the business will deliver or require in the future
– It contains nothing about how risky earnings are, either now or in the future
– It says nothing about the need for or role of intangible assets which are an increasingly important ingredient in many companies
– It is easily manipulated or distorted using perfectly legal accounting conventions
– It gives a poor signal between good growth, which advances the wealth of the organisation and bad growth, which despite producing a positive outcome is nevertheless lower than the (“unaccounted”) cost of equity capital and hence destroys value.
Execution and the Marshall?
Thus earnings-driven metrics do not comply with Alfred Marshall’s definition of value creation and hence decisions made when using accounting earnings are in grave danger of giving managers the wrong signal when considering strategic alternatives and trade-offs. When strategies fail to produce anticipated returns, Boards and management teams quickly turn to the cult of execution – “our strategy is right, it is just that we need greater focus on execution.’
Whilst the importance of strategy delivery and the need for executives with the “skill and will” is acknowledged, an incorrect assessment of the organisation’s competitive/economic position is usually the most likely cause of a strategy failing to deliver.
An Economic Return
Upon the understanding and realisation in embracing value creation and thus the prevention of value destruction, many organisations adopt a value-based perspective for their strategy deliberations. Central to this is the use of economic profit defined as net operating profit after tax less a charge for all the capital used by the business.
Over time, many organisations have achieved staggering returns for shareholders, including Coca-Cola under Roberto Goizueta and Lloyds Bank under Brian Pitman, when adopting a value-based approach.
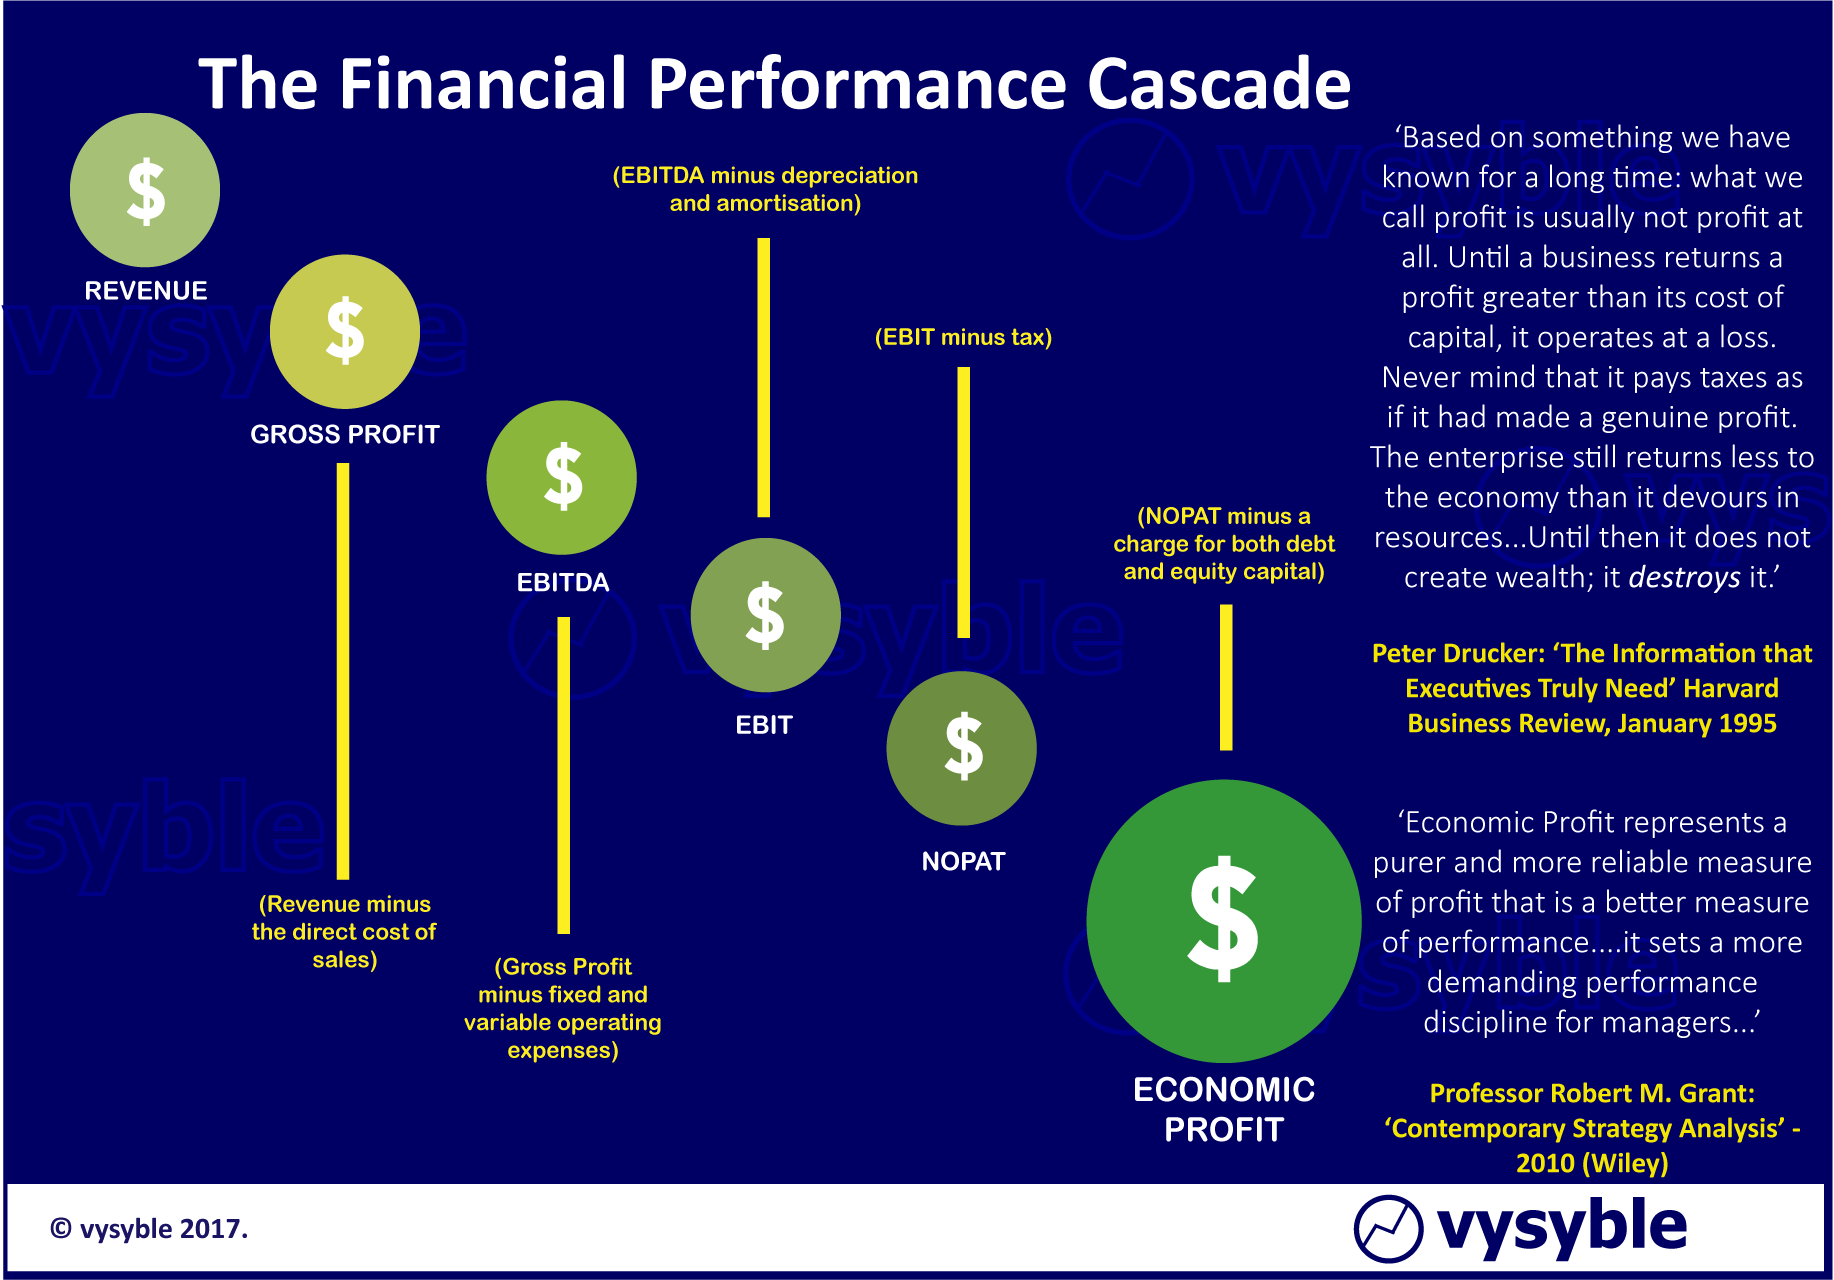
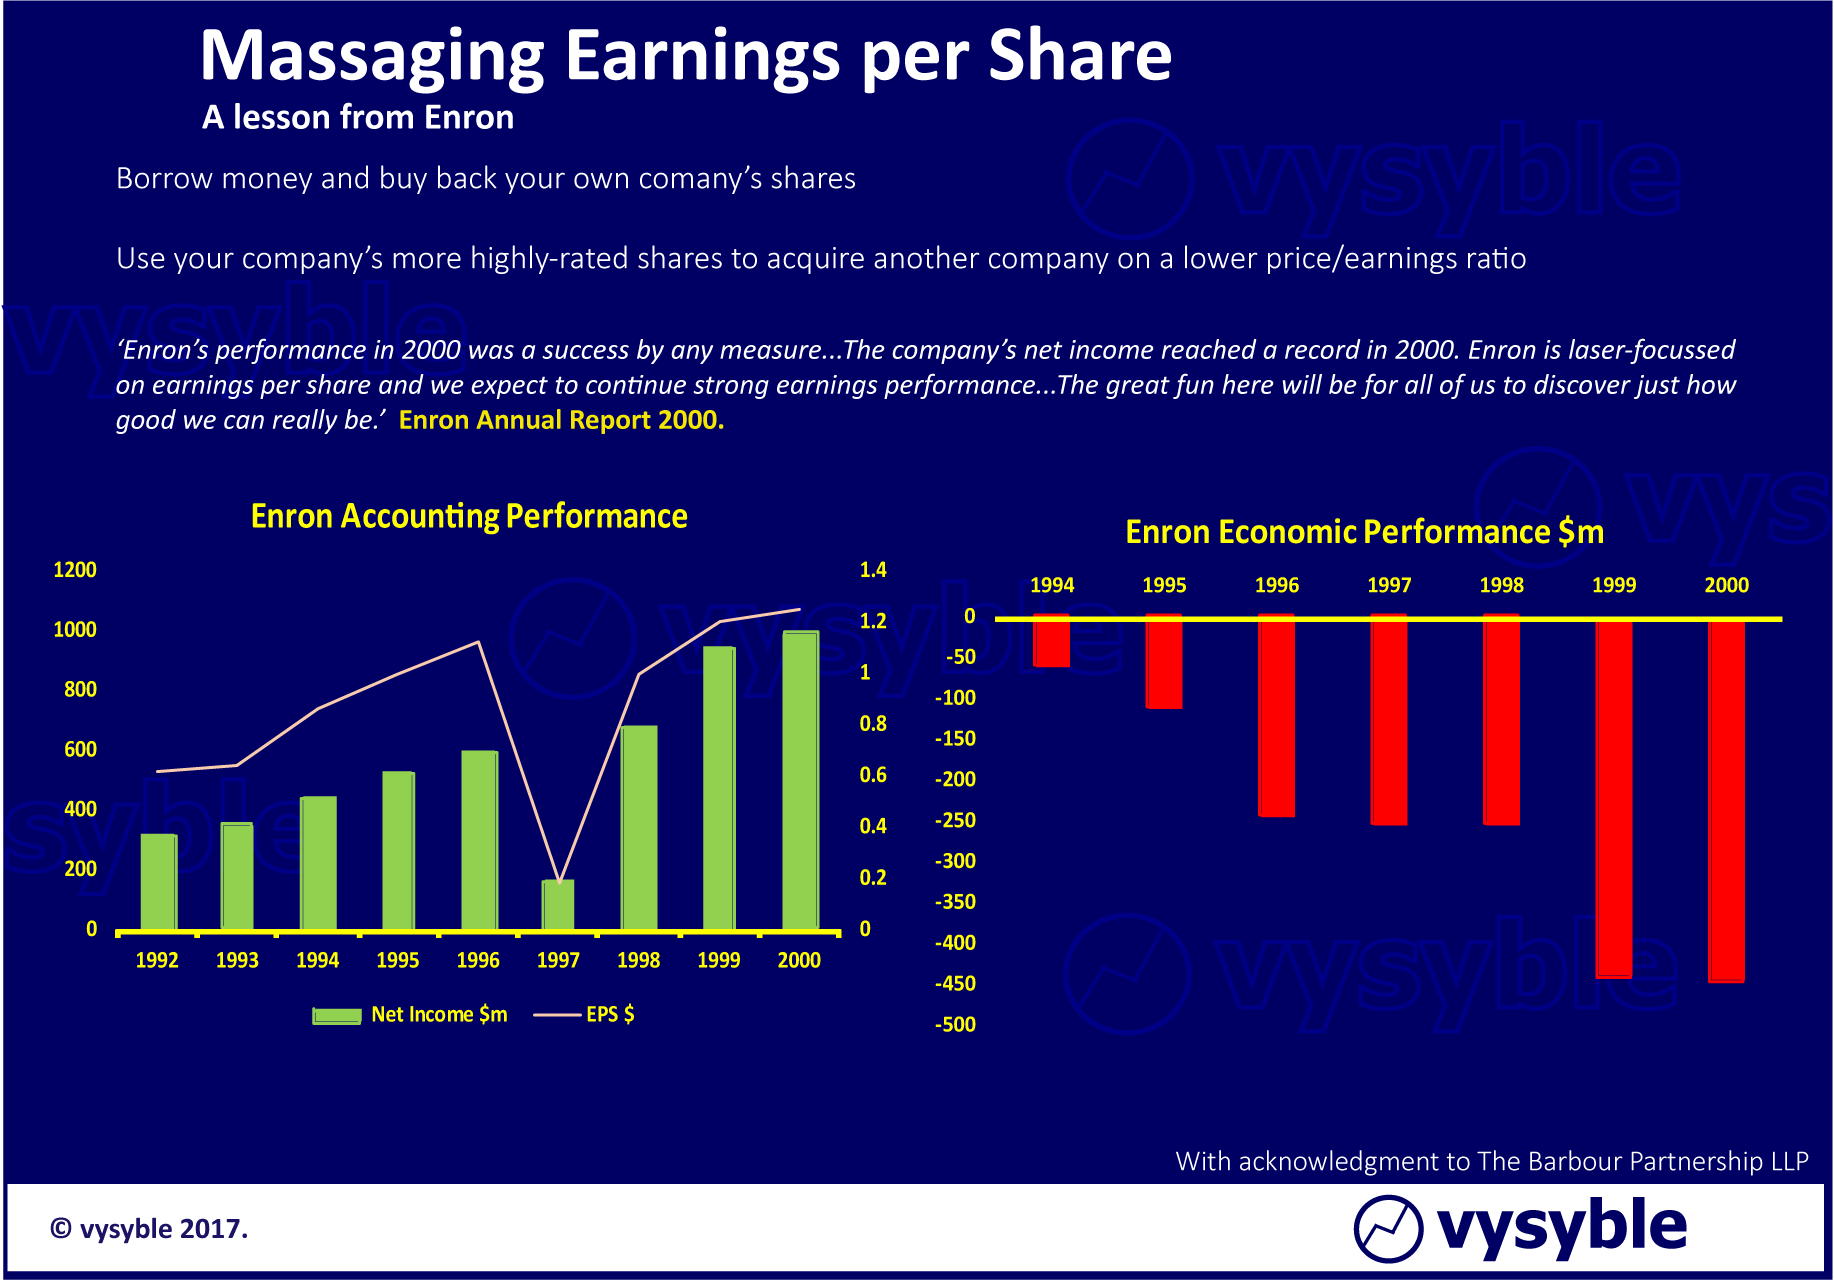
Unlike any other business metric, economic profit combines three things; the profit and loss account (NOPAT), the balance sheet (to calculate Invested Capital and from that the capital charge) and an external capital market measure, all in one number. It differs from accounting profit because it includes an expense for the required return of shareholder capital and hence has a superior strategy signalling attribute – see below the example from Enron…
Although there were several factors behind Enron’s eventual collapse, having a governing objective (earnings per share) so misaligned with value creation was undoubtedly a major factor.
The Economic Performance of the English Premier League
The English Premier League is widely revered as the wealthiest soccer league in the world by annual revenue. And therein lies the problem.
Despite its media prominence, examination of the financial and economic performance of the individual clubs often focuses on revenue as the sole barometer of financial health. The general journalistic assumption that cash and “profit” are ‘one and the same’ only adds to the confusion.
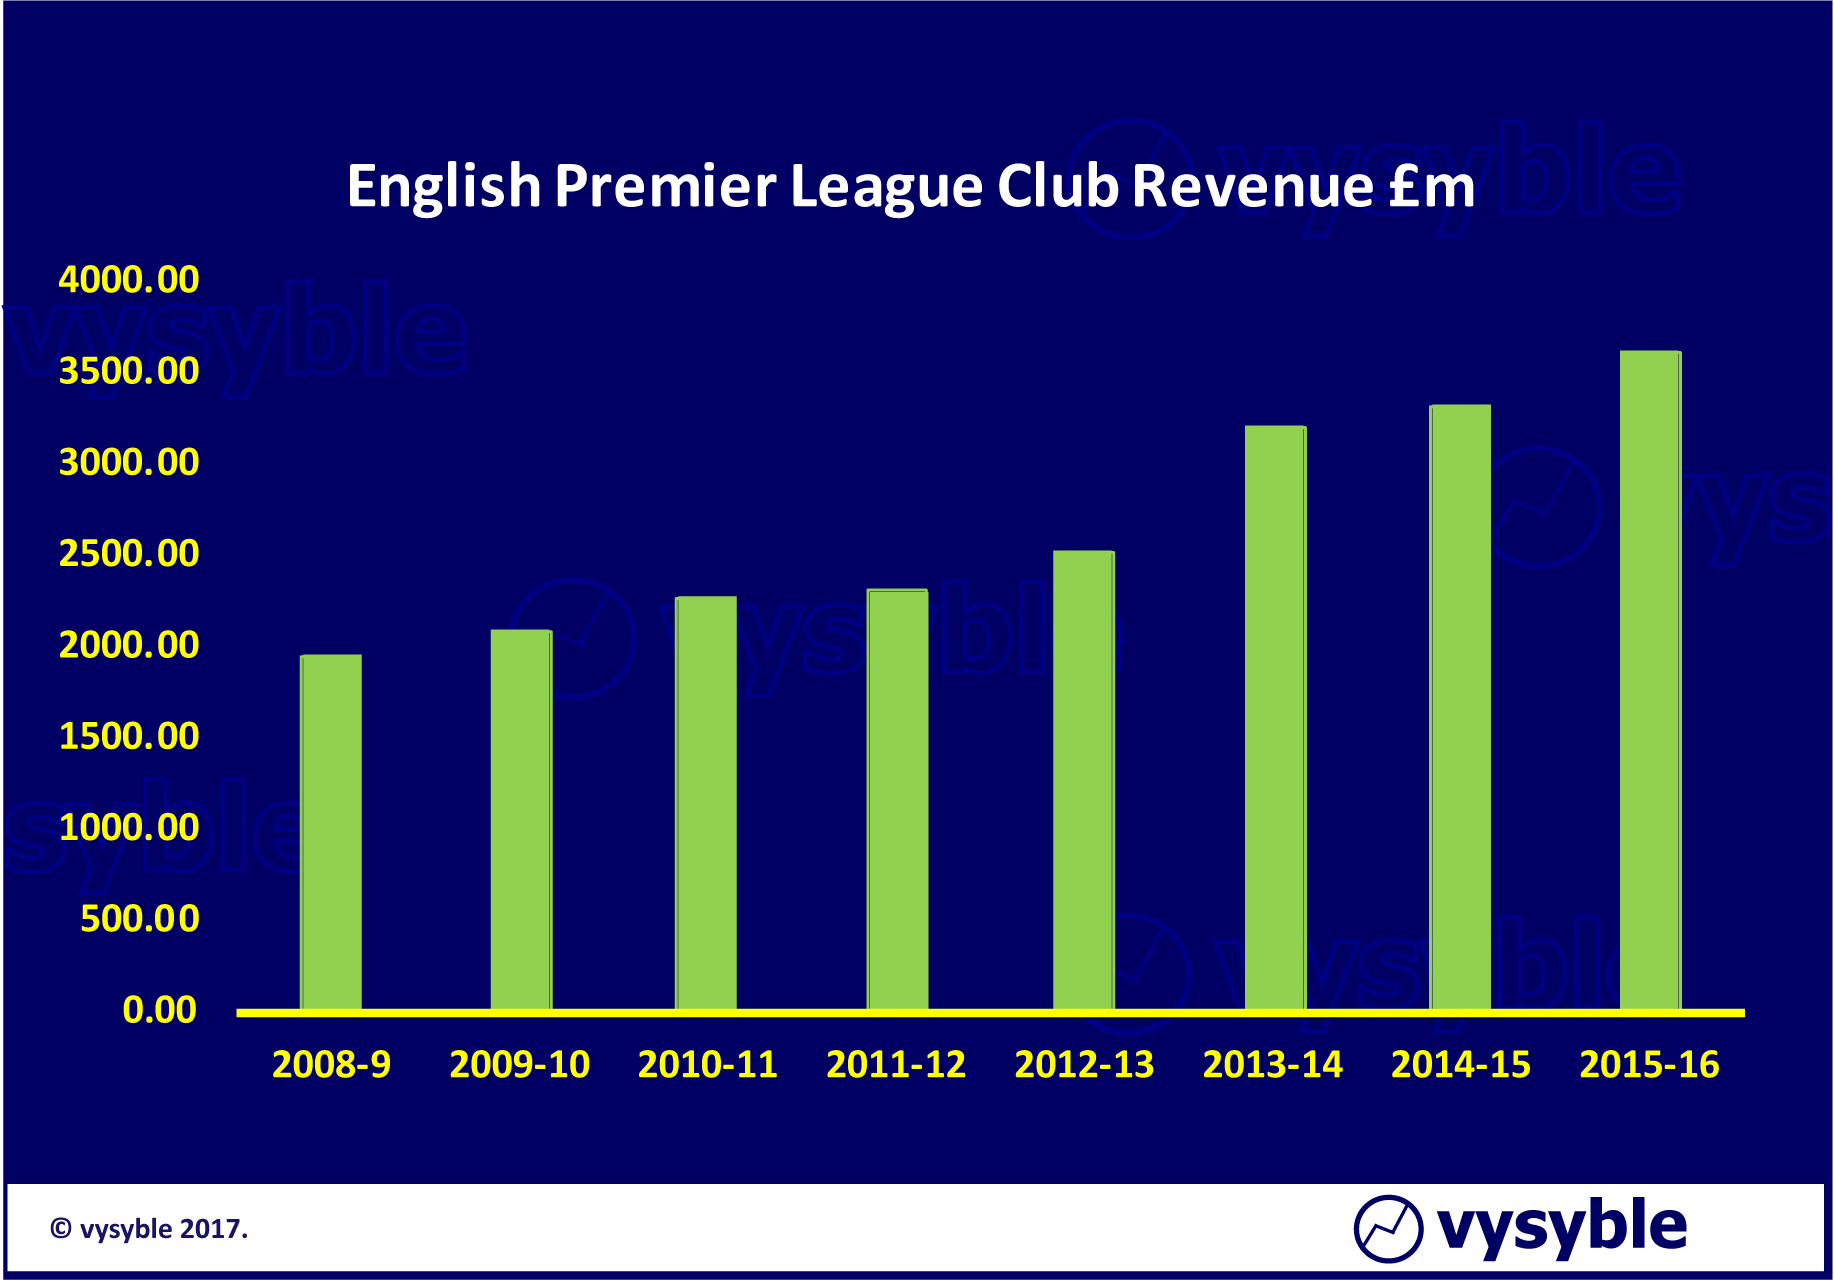
It is very easy to see why commentators believe that the finances of the game are healthy when judged on the revenue performance alone. Revenues have risen by £1.65bn – from £1.95bn in 2008-9 to just over £3.6bn in 2015-16; an absolute increase of 85% or 9.2% compound.
However, if performance is viewed through an economic profit lens the picture is one of consistent value destruction where the NOPAT value is insufficient to cover the charge for capital, despite the £1.65bn increase in revenues.
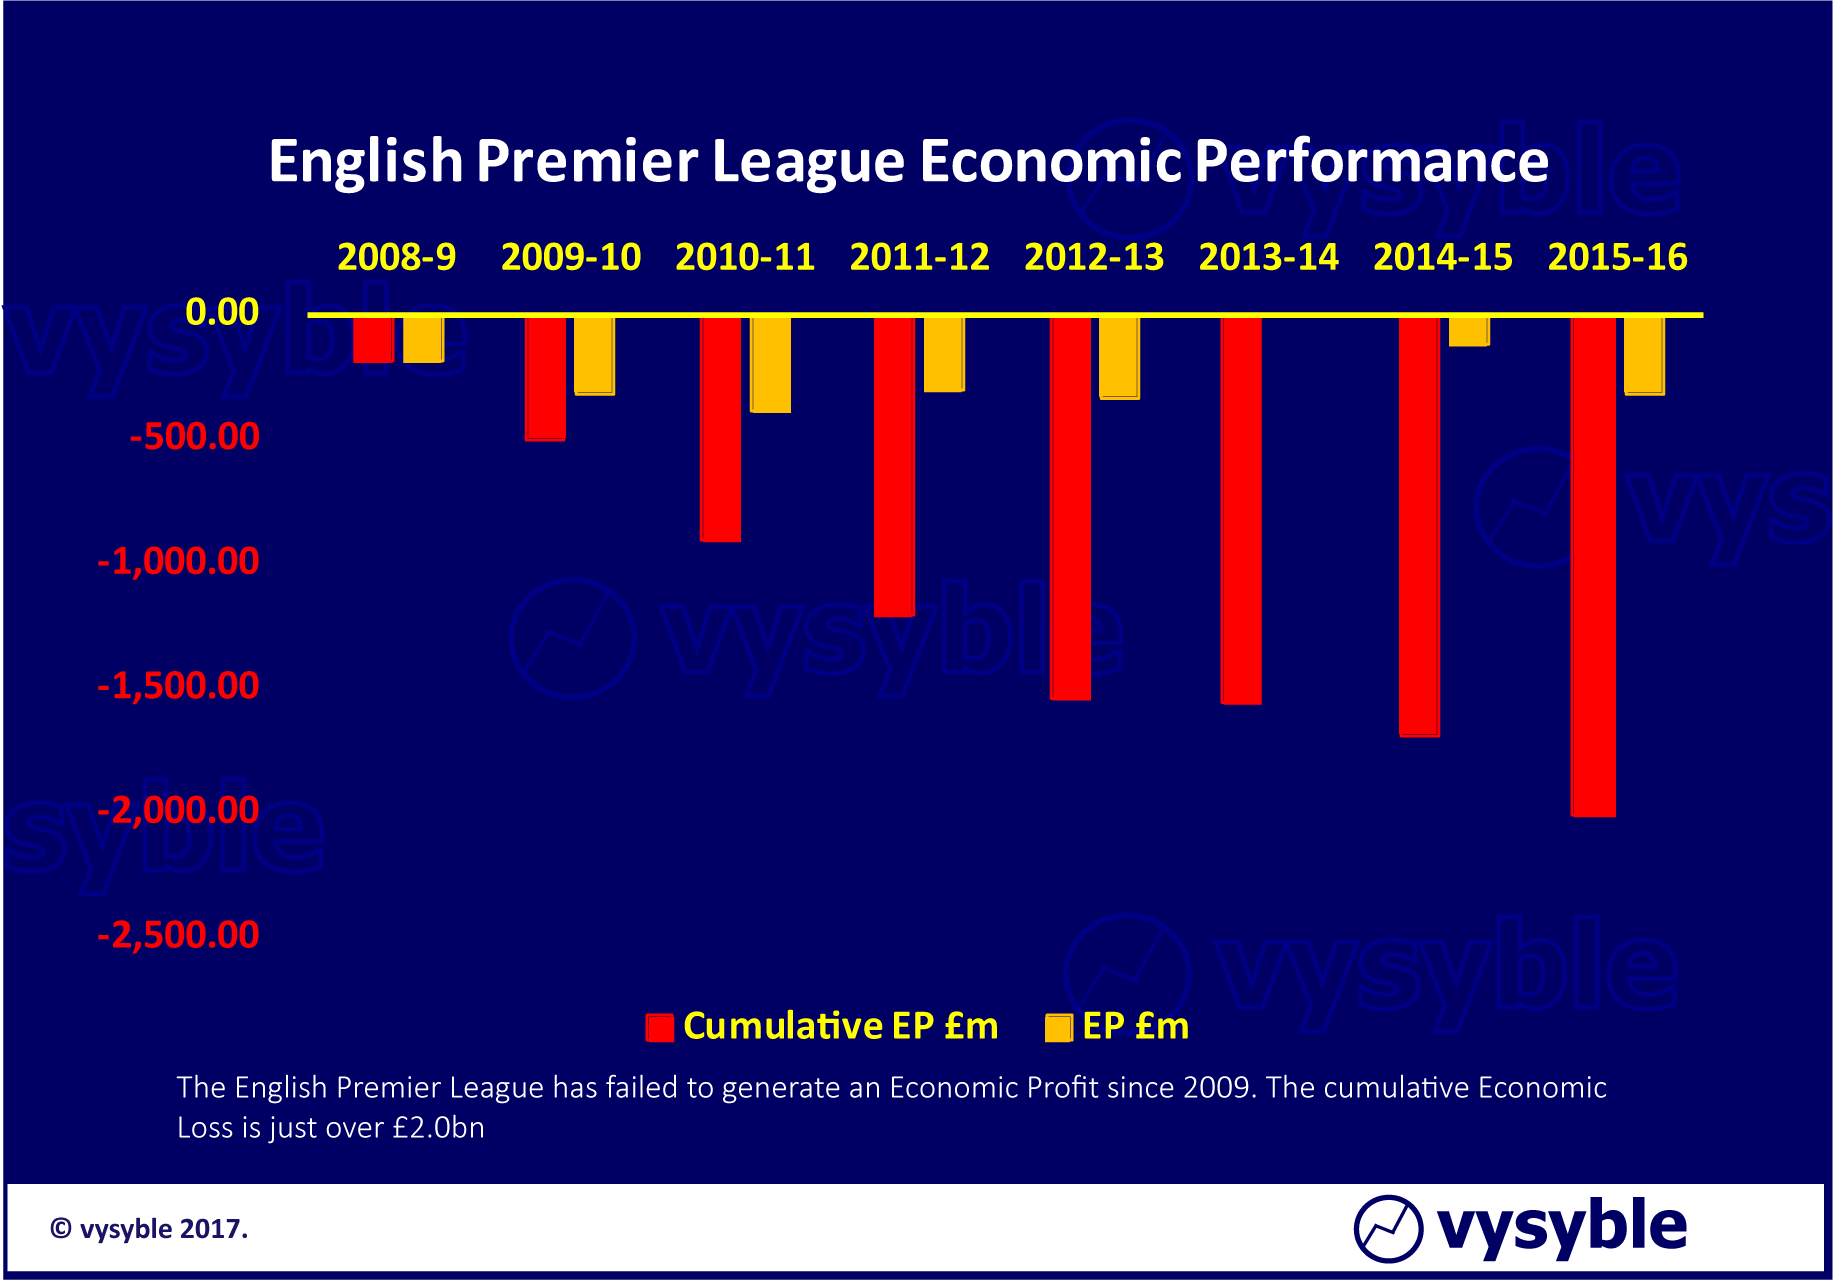
Over the period, the gap between NOPAT and the charge for capital is £2.0bn. The club owners have, as Peter Drucker would say, devoured more in resources than they have generated.
In breaking down economic performance into the components of revenue, expenses, the charge for capital and the resulting economic profit, the revealing values tell a very interesting story about Premier League fiscal sensibilities.
The expenses line has been reversed so that a movement comparison against the uplift in revenue can be facilitated.
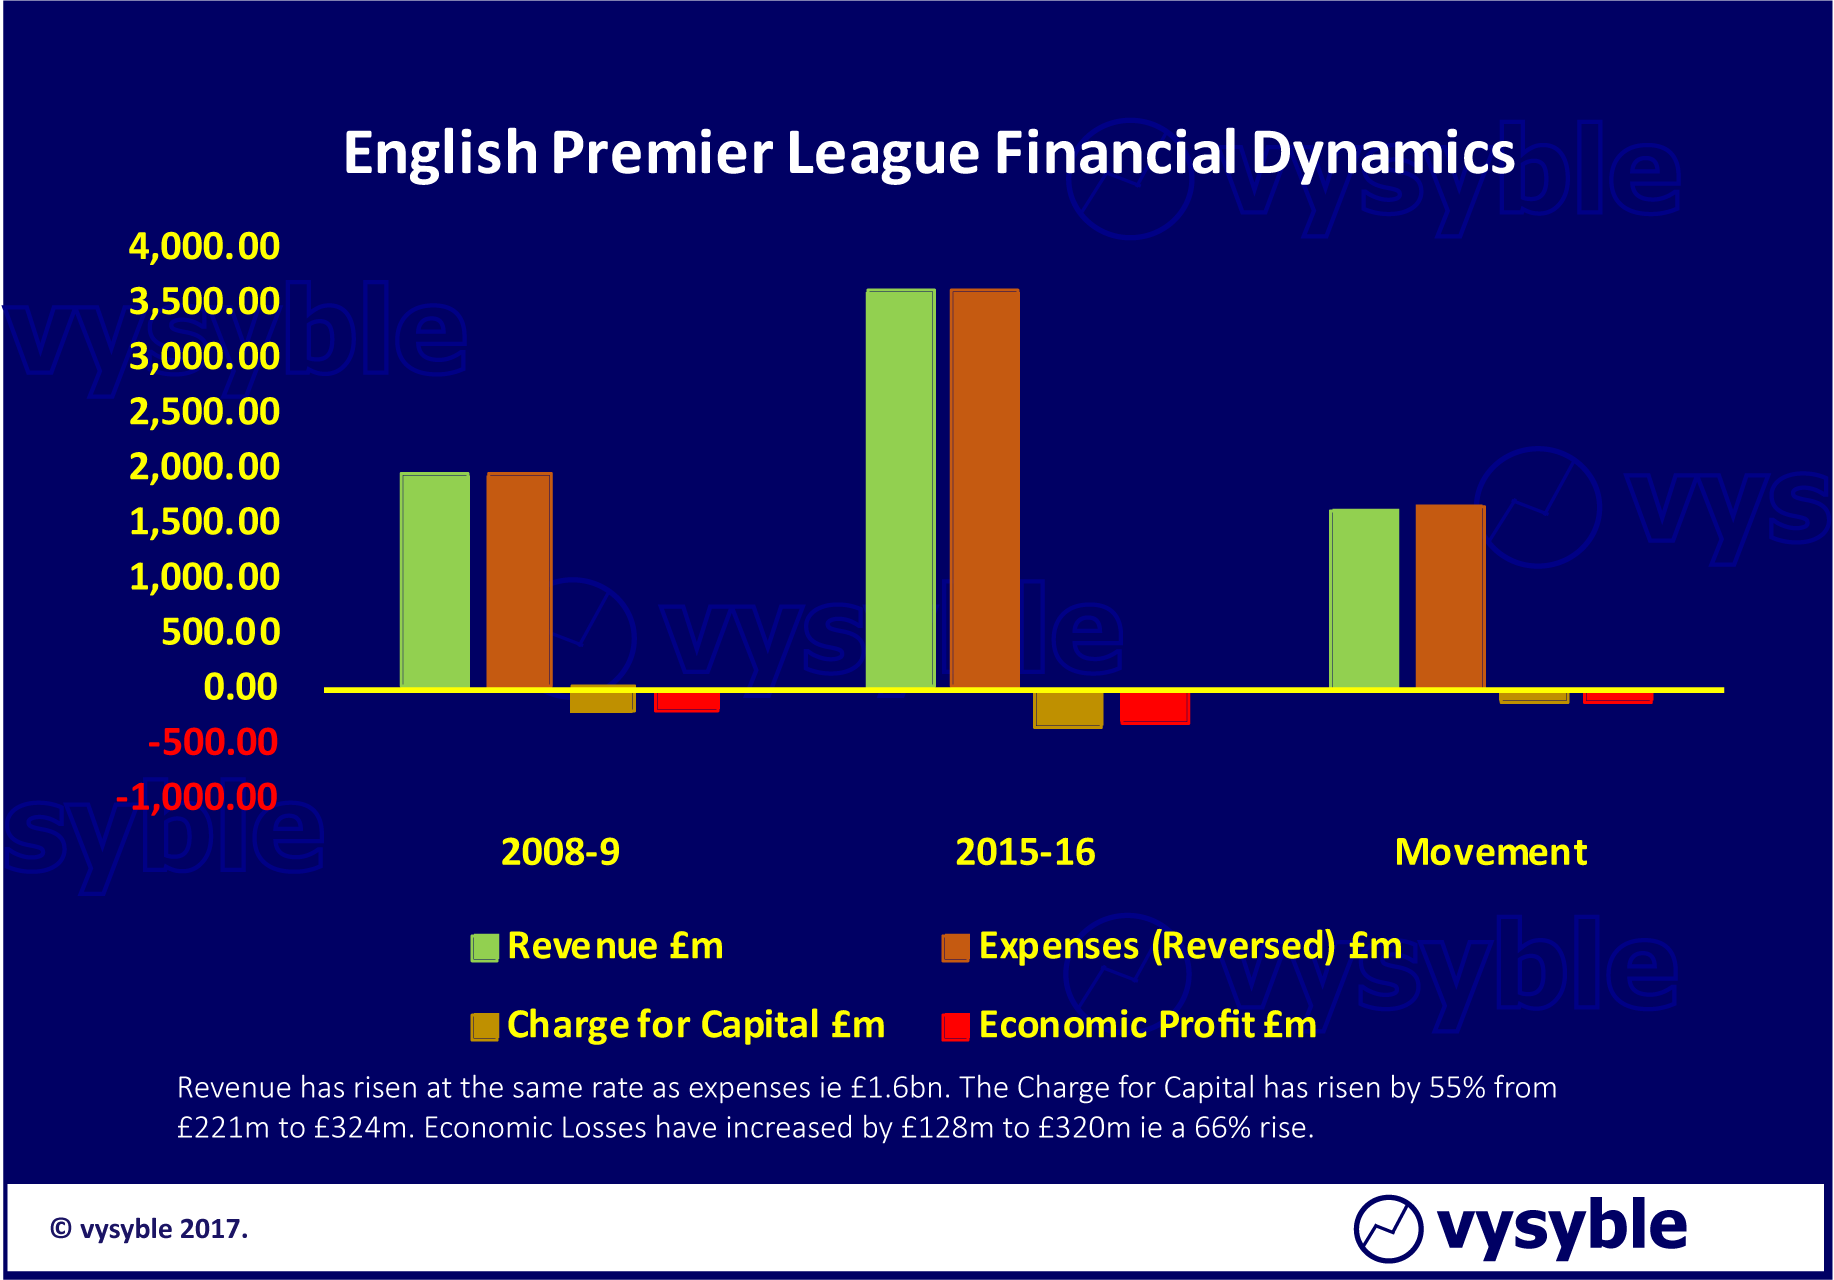
Expenses including taxation are rising as fast as the revenue line. The charge for capital, as the value of assets ie predominantly the players, has risen by some 55% and the economic loss in 2015-16 is some £128m greater than the loss in 2008-9. All of this is against a backdrop of an 85% increase in revenues.
When we examine the economic efficiency of Premier League football clubs in generating economic profits when compared to their revenue performance ie the EP/R value, it is evident that there has been little improvement despite the significant increase in revenues. Can it also be assumed that strategic thinking has not changed? Probably…
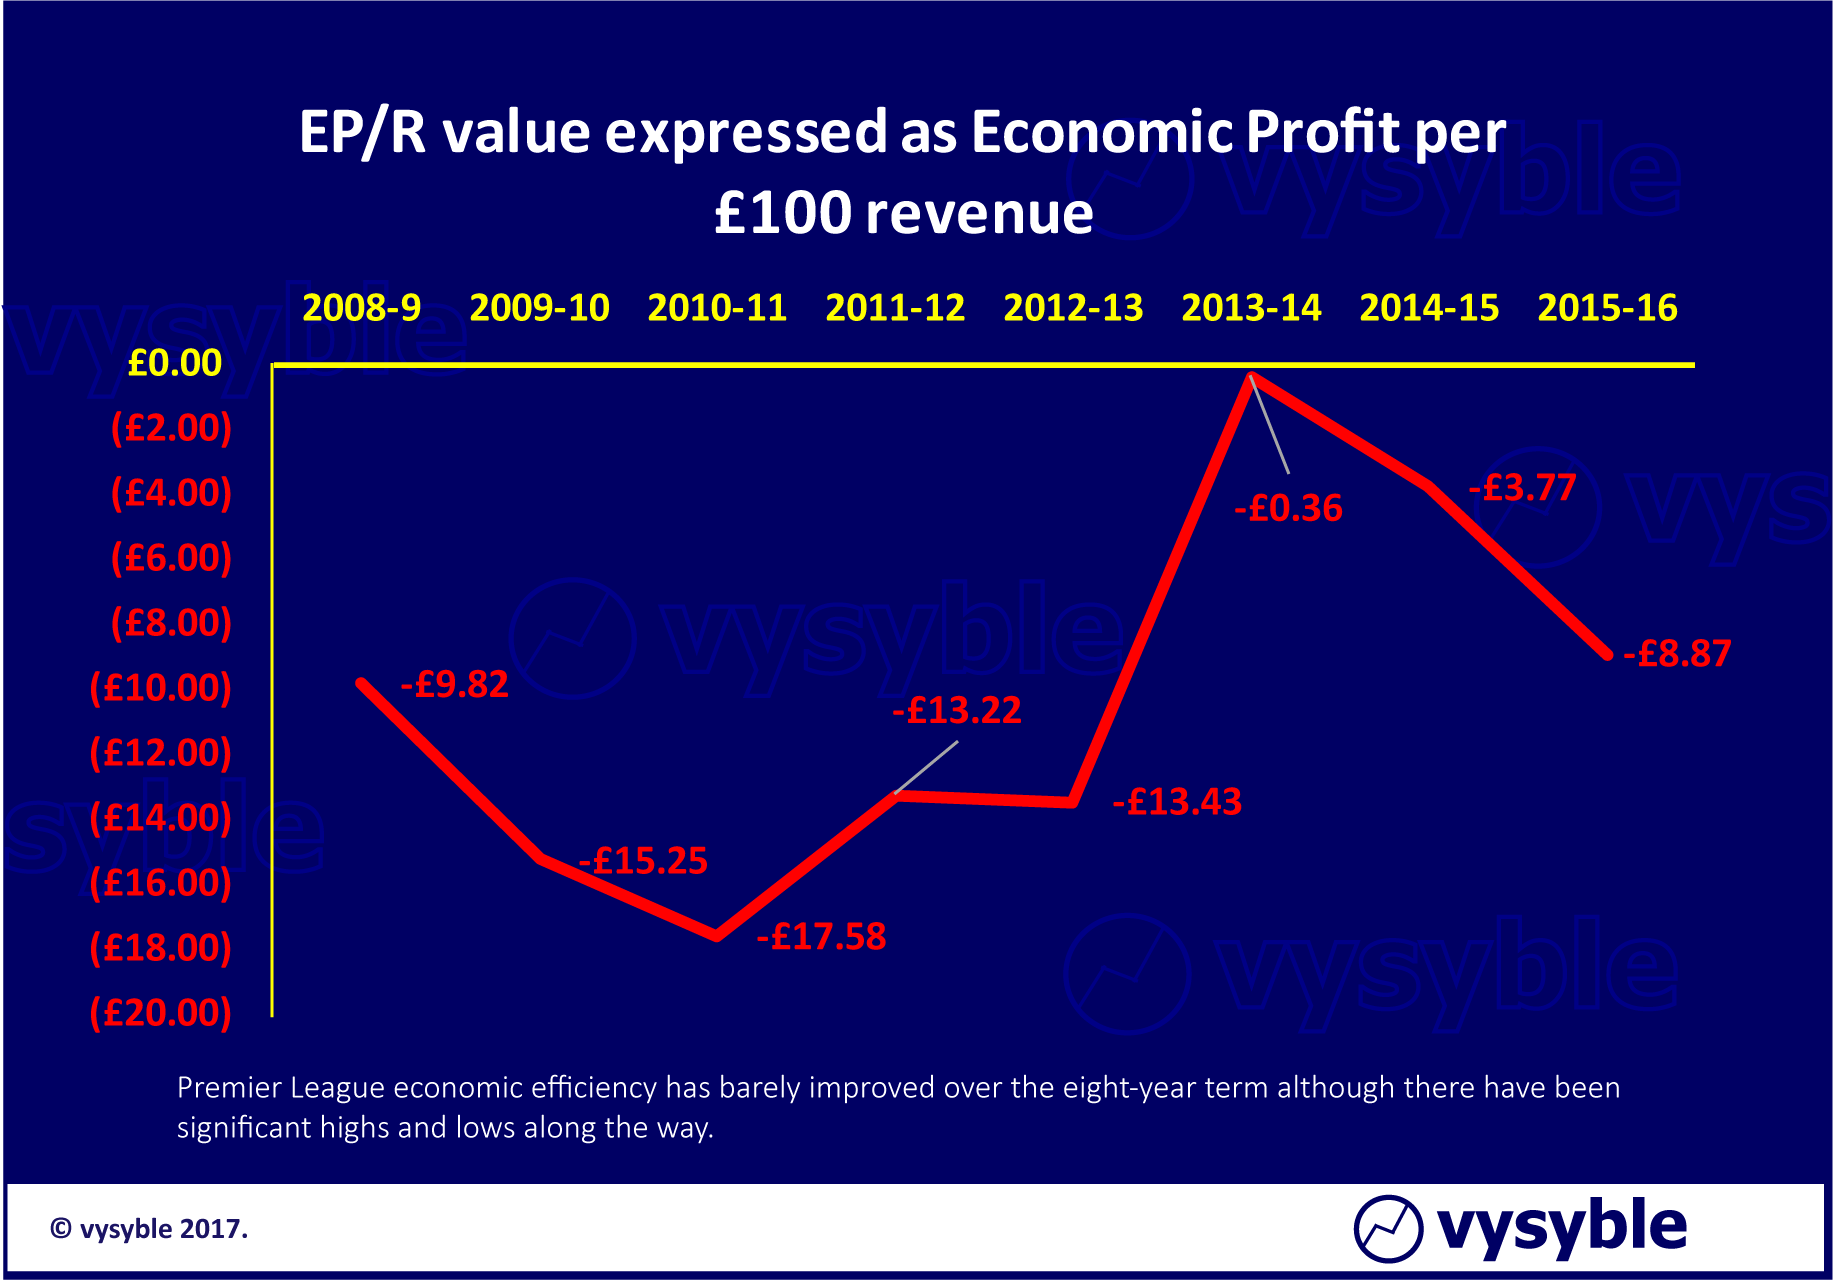
Whilst there are industries where average economic profitability is constantly challenged eg airlines and paper manufacturing, football clubs do achieve economic profits. The problem is the lack of consistency in doing so.
Increasing player transfer fees, wage costs, taxation and capital erosion all play their part. Competition is increasingly driven by the club(s) that spends (on a net basis) the most on player transfers. However, revenue in isolation is not an indicator of economic prowess.
The Top 7 Premier League clubs by revenue exhibit a 19% probability of achieving an economic profit whilst the division overall exhibits an economic profit probability of 31%. Clubs with good economic records can and do get relegated eg Burnley, Norwich City, Newcastle United, Hull City.
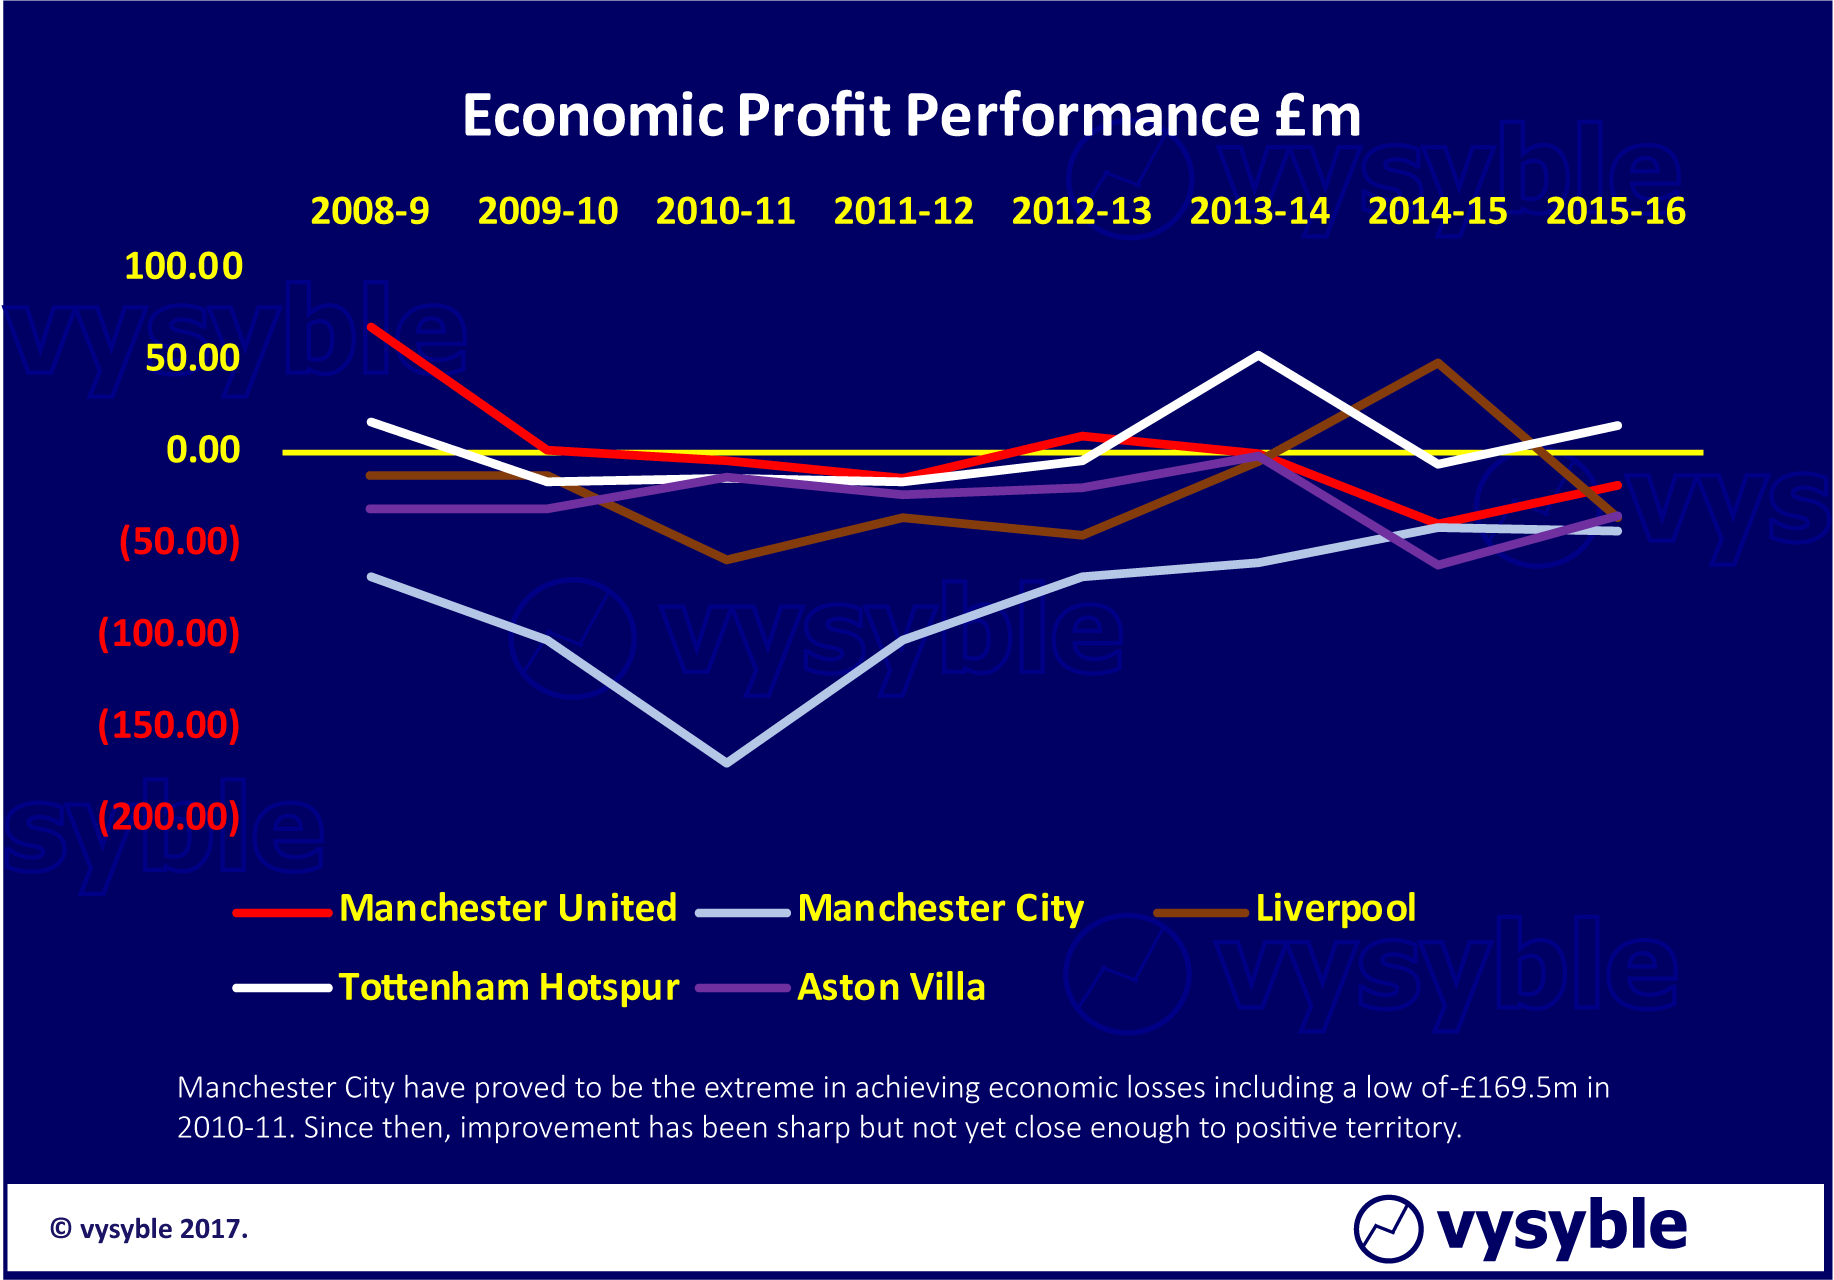
Further economic performance diversity is aptly demonstrated by comparing the best performer – Tottenham Hotspur – with the worst – Manchester City – and a few others for good measure.
The prudent stewardship of Tottenham Hotspur contrasts strongly with the deep economic losses incurred by Manchester City. Yet Tottenham have finished above Manchester City in the most recent two Premier League seasons.
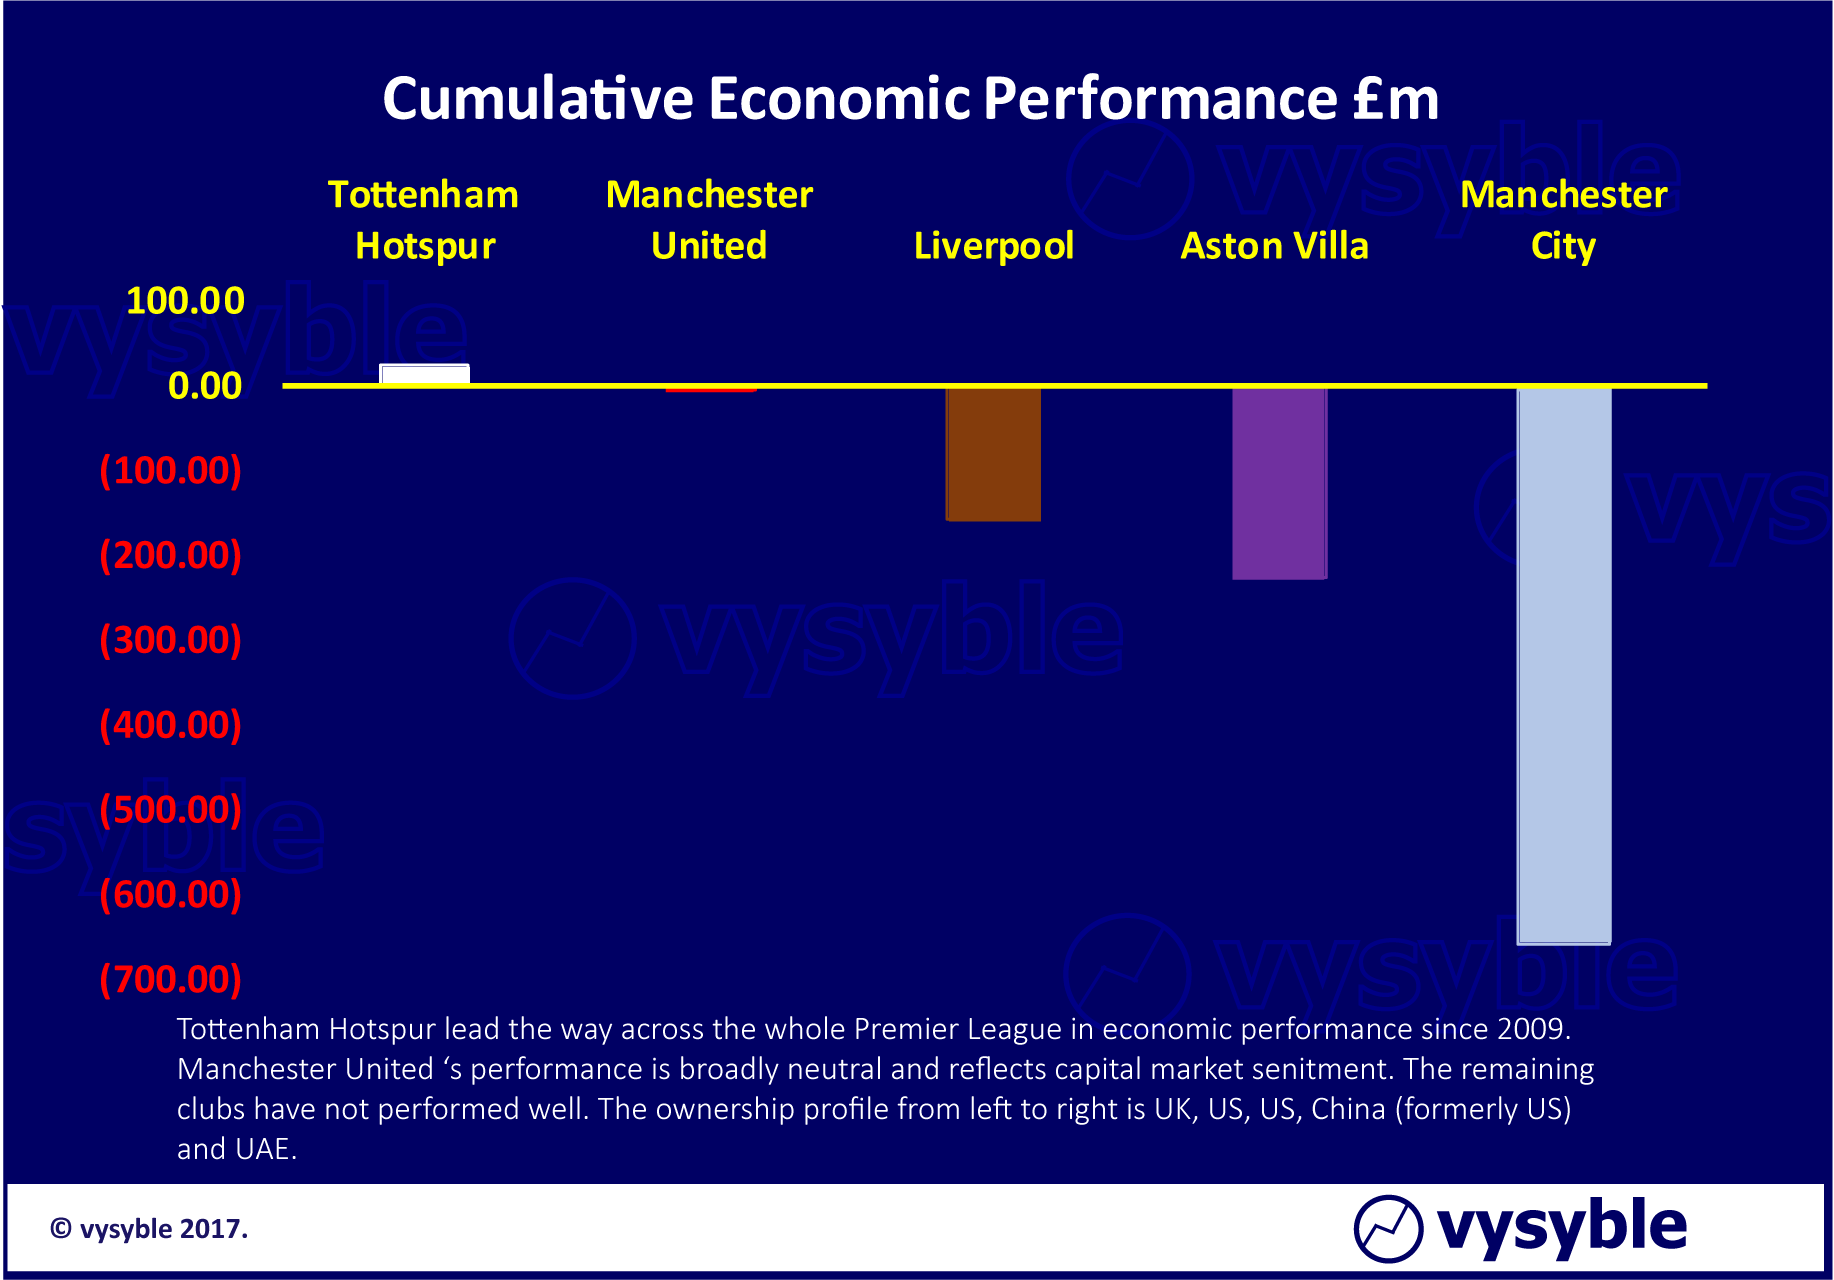
Aston Villa now play in the second tier of English Football. The club’s economic record from 2009 onwards is the fifth-worst record of any club (34 to be exact) to have played Premier League football during the period of analysis behind Manchester City, Chelsea, Sunderland and QPR. Liverpool sit in 7th from bottom place.
The dichotomy is that the top 7 clubs incur greater economic losses overall to compete locally and in European competition whereas the remaining 13 clubs tend to operate within a more sensible fiscal regime despite the threat of relegation and the inevitable reduction in revenues (often 40-60%).
There is also the cultural and somewhat emotional dimension to consider. The origins of many English football clubs hark back to the days of village and town-based teams. Links to their local communities are therefore strong. Community responsibility, however, cannot run to a cumulative economic loss of £2.0bn over an 8-year period.
Yet commentators also protest that clubs are not designed for ‘profit’. Thus, what is an acceptable level of (economic) loss? An average of £251m pa for the Premier League division over 8-years?…
How important is TV money to Club Revenues?
Since the start of the Premier League 25 years ago, the contribution from television rights (in the main Sky PLC) has been significant, rising from £38m pa in 1992 to £1.7bn pa in 2017 – a compound interest rate of 16% per annum. A pint of beer costing £1.44 in 1992 would now cost £65 by comparison. Consumer affordability can only go so far. Each renewal has generally injected increased monies into the pot and pushed the underlying and problematic economic situation further into the long grass.
Today, the contractual cost weighs heavily on Sky. The comparative economic performance of the company in 2012 and in 2017 based on the latest accounts release is shown below;
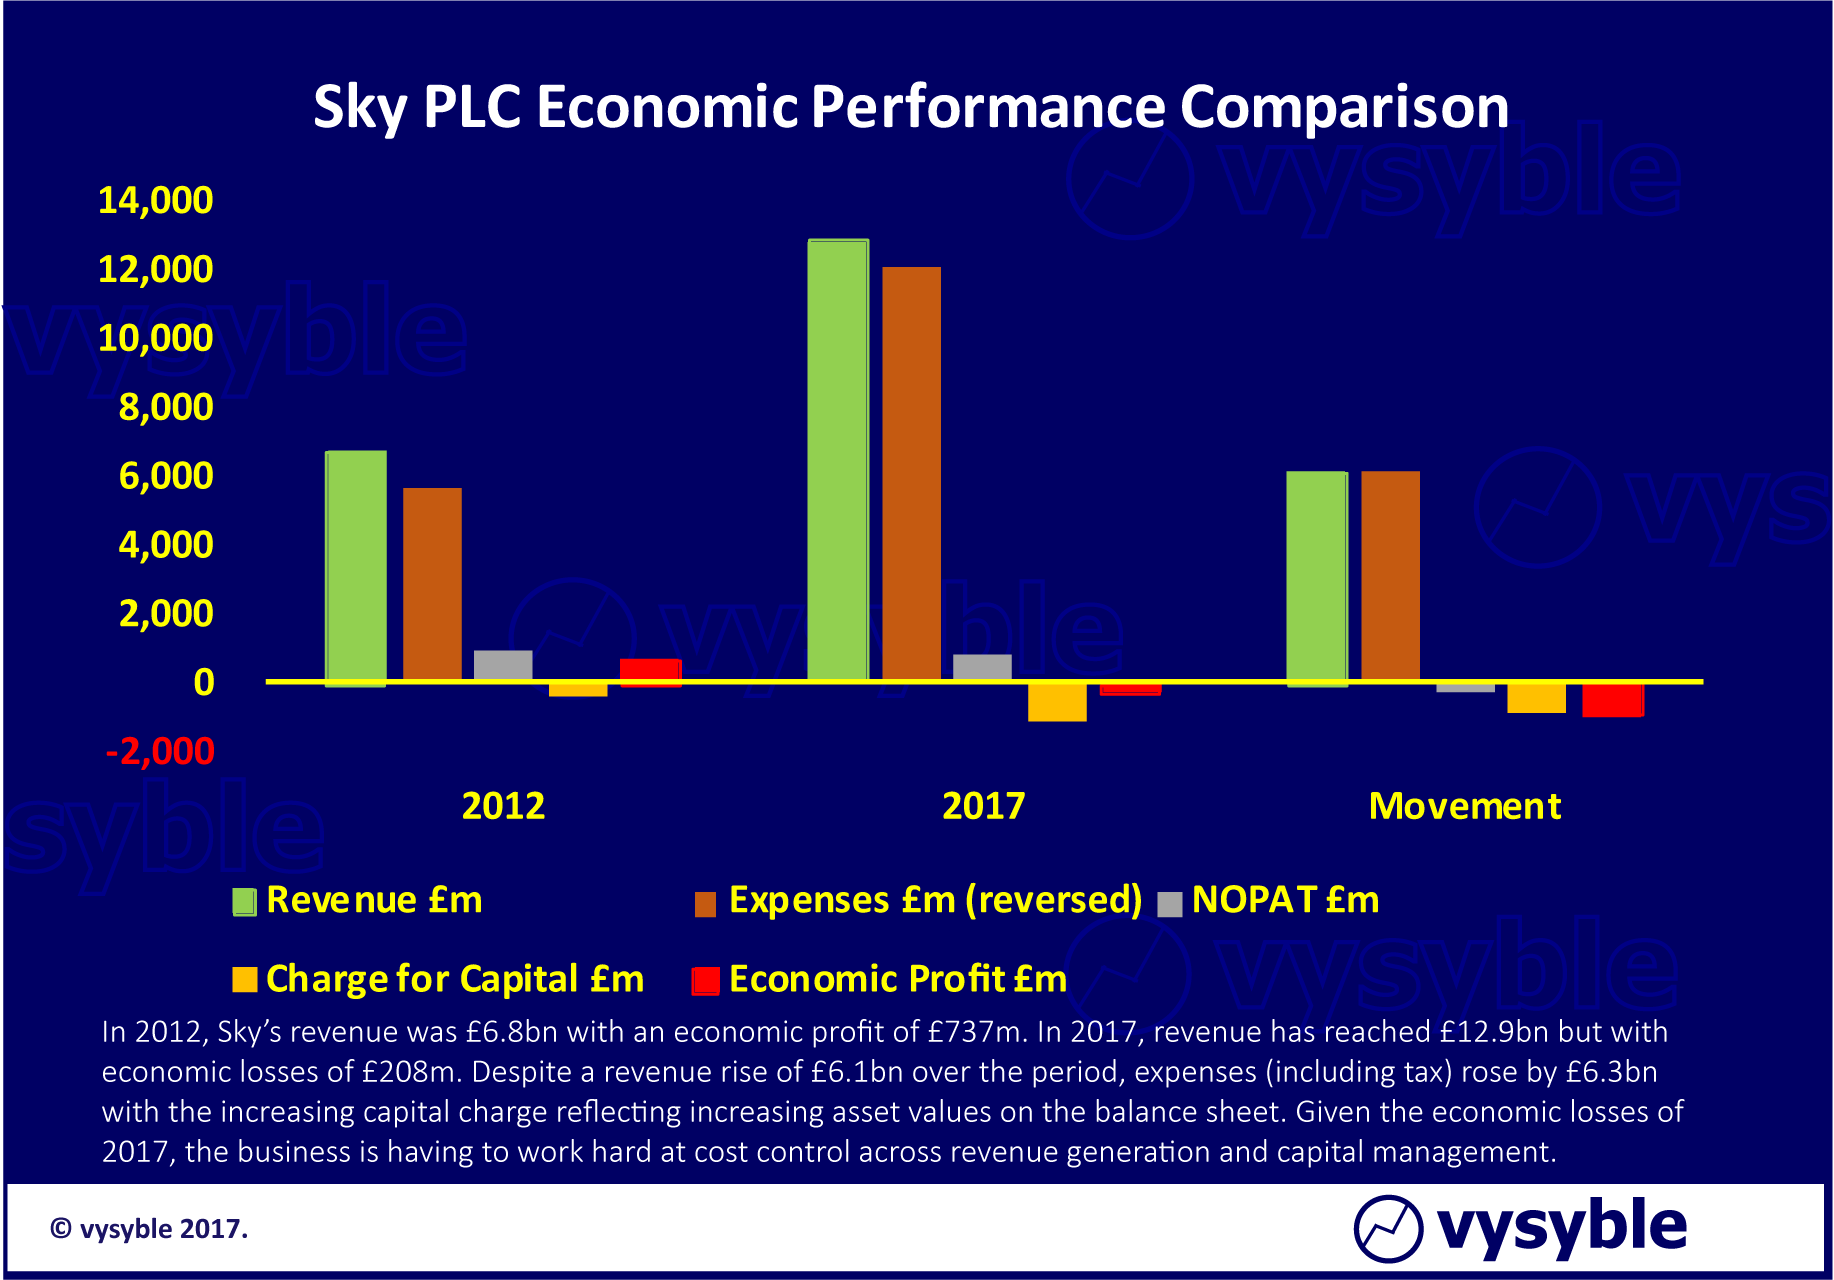
The next renewal point is 2019 although the actual terms are expected to be announced in early 2018. The company’s ability to compete financially is increasingly being questioned. There is also a political dimension given the proposed Fox takeover of Sky.
Manchester United derives 24% of its £500m+ income from TV. Tottenham Hotspur’s TV take makes up 45% of its revenue. However, most clubs rely on TV to contribute between 60-80% of overall revenue. Therefore, the risk to club revenue is self-evident.
With the method and means of media consumption changing rapidly – perhaps due to consumer price resistance and increasing access to new and cheaper technology – together with Sky seemingly struggling with its current financial commitments, are the finances of the Premier League reaching an inflexion point?
Non-UK rights to broadcast Premier League football have increased in value to £1.07bn pa. The expectation is that any potential shortfall in domestic revenue will be offset by further increases in foreign rights values. This may be so, but it is apparent that the UK market has reached maturity and is unlikely to provide the historical 70% revenue increases every three years going forward.
Some commentators have postulated the entry of a FANG (Facebook, Amazon, Netflix, Google) constituent into the bidding process for Premier League media rights. The question is whether a FANG can make such a move profitably. Sky has 25 years of experience-curve benefits and yet it struggles to make an economic return. To drive value and viability, it may take more than just access to a ready-made platform or a 9-figure audience reach.
The inference, however, is clear in that without increasing levels of media revenue, the Premier League simply cannot continue to function at current levels given the economic laxity displayed by many clubs.
Conclusion
Daniel Levy, Chair of Tottenham Hotspur, remarked on the scale of Premier League summer transfer spending at a Nasdaq Q&A on 25 July 2017:
“My view is that it’s totally unsustainable. I don’t think that long-term for any club it’s sustainable to spend more than you earn. You can have periods where you do but over the long-term you can’t.”
Several days afterwards and speaking on UK national radio, the Chair of Stoke City, Peter Coates, echoed a similar perspective to Levy:
“We’ve tried not to over-spend in what is a very inflated market and that is never easy.”
Jose Mourinho, Manager of Manchester United was also quoted:
“I always thought the problem is not what you pay for these kind of [top] players, I don’t think the problem is what you pay for Pogba, I don’t think the problem is going to pay crazy for Neymar…I think the problem is with the other group, which is a big group because players like Pogba, there is one or two [big] transfers [like that] per transfer window. The other ones are where you have 100 transfers and for me that is the dangerous area of the market.”
Daily Telegraph “Dangerous” fees pose major threat to game – 25 July 2017.
In contrast, Richard Scudamore, the Executive Chair of the Premier League, put forward a confident perspective about the division’s finances:
“Profitability is improving…The most important thing is player costs as a percentage of turnover. We’re down in the early 60 per cents and we were much higher 10 years ago. Sixty per cent of turnover spent on player costs is actually very manageable.”
Daily Mail – Spending Spree is Sustainable as latest foreign TV deal promise incredible revenue rise – 23July 2017.
Judging the economic health of any organisation purely on the ratio of staff/players costs to revenue is highly questionable. The metric can remain stable whilst the underlying economic position deteriorates. Using the wrong metric to gauge performance is not unlike the Enron management team’s misplaced and misguided emphasis on earnings per share.
Economic profit reveals much about the performance of the organisation to management teams that was previously undiscovered. Only when the true economic position is determined can management efficiently allocate resources and strategically address such issues.
Football clubs allocate economic resources in the same manner as any other commercial organisation. For any potential investor, an economic midfield of Smith and Marshall alongside Modigliani and Miller – for their work on capital structure – will provide sufficient reference and transparency in terms of performance and value.
Without a value-based and strategic approach, football’s economic back-pass will persist to its ultimate detriment.